|
Download Data (XLS File) |
|
||||||||
|
||||||||
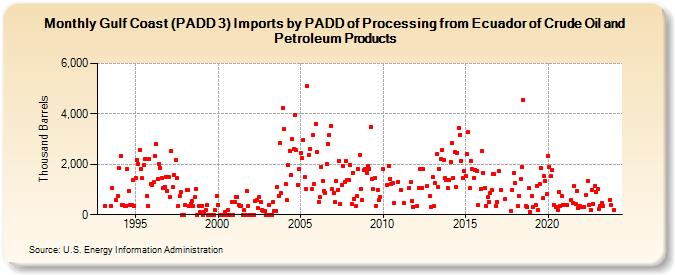
| Gulf Coast (PADD 3) Imports by PADD of Processing from Ecuador of Crude Oil and Petroleum Products (Thousand Barrels) | ||||||||
| Year | Jan | Feb | Mar | Apr | May | Jun | Jul | Aug | Sep | Oct | Nov | Dec |
|---|---|---|---|---|---|---|---|---|---|---|---|---|
| 1993 | 359 | 358 | 1,071 | 581 | 733 | |||||||
| 1994 | 1,837 | 2,324 | 378 | 378 | 365 | 359 | 1,817 | 958 | 376 | 379 | 1,373 | 342 |
| 1995 | 1,471 | 2,182 | 2,002 | 2,582 | 1,802 | 1,443 | 1,978 | 2,222 | 756 | 360 | 2,210 | 1,211 |
| 1996 | 1,171 | 1,283 | 2,327 | 2,799 | 1,429 | 2,007 | 1,855 | 1,450 | 1,070 | 1,117 | 1,503 | 940 |
| 1997 | 1,512 | 719 | 2,513 | 1,086 | 1,582 | 2,177 | 1,438 | 360 | 745 | 896 | 0 | 0 |
| 1998 | 378 | 977 | 978 | 335 | 419 | 549 | 348 | 691 | 1,032 | 0 | 358 | 97 |
| 1999 | 357 | 0 | 93 | 180 | 371 | 0 | 0 | 0 | 0 | 0 | 172 | 732 |
| 2000 | 376 | 0 | 0 | 0 | 0 | 94 | 0 | 193 | 0 | 0 | 507 | 0 |
| 2001 | 500 | 719 | 718 | 378 | 360 | 359 | 0 | 186 | 0 | 922 | 364 | 0 |
| 2002 | 0 | 0 | 0 | 540 | 571 | 262 | 713 | 513 | 168 | 166 | 159 | 0 |
| 2003 | 0 | 378 | 0 | 0 | 507 | 160 | 159 | 1,116 | 748 | 2,851 | 859 | 4,224 |
| 2004 | 3,395 | 1,216 | 566 | 1,967 | 2,541 | 1,578 | 3,015 | 2,604 | 3,975 | 2,563 | 1,191 | 1,803 |
| 2005 | 2,433 | 2,233 | 2,969 | 1,495 | 1,009 | 5,091 | 2,388 | 2,602 | 1,038 | 3,147 | 1,216 | 3,601 |
| 2006 | 2,474 | 519 | 712 | 1,895 | 1,328 | 945 | 867 | 2,000 | 2,811 | 3,171 | 3,532 | 1,034 |
| 2007 | 855 | 497 | 1,357 | 966 | 2,126 | 440 | 1,186 | 1,921 | 1,282 | 2,125 | 1,389 | 1,390 |
| 2008 | 1,984 | 439 | 1,668 | 605 | 364 | 736 | 1,804 | 2,384 | 1,025 | 590 | 1,784 | 1,816 |
| 2009 | 1,657 | 1,918 | 1,815 | 3,480 | 1,400 | 1,007 | 1,472 | 361 | 999 | 574 | 705 | |
| 2010 | 1,817 | 1,193 | 1,949 | 1,435 | 1,209 | 1,274 | 468 | 1,314 | ||||
| 2011 | 996 | 450 | 1,068 | 1,280 | 528 | 323 | ||||||
| 2012 | 340 | 1,077 | 1,795 | 1,058 | 1,807 | 1,120 | 739 | 325 | ||||
| 2013 | 1,477 | 326 | 1,271 | 2,392 | 1,094 | 1,807 | 2,208 | 2,569 | 2,190 | 1,440 | 1,386 | 1,053 |
| 2014 | 1,367 | 2,105 | 2,848 | 1,460 | 2,489 | 1,087 | 2,463 | 3,459 | 3,159 | 2,145 | 1,439 | 1,716 |
| 2015 | 1,528 | 2,408 | 3,279 | 1,048 | 2,149 | 1,812 | 1,448 | 1,789 | 1,739 | 366 | 1,031 | |
| 2016 | 2,525 | 1,660 | 1,074 | 352 | 684 | 523 | 854 | 990 | 1,630 | 1,612 | 343 | 515 |
| 2017 | 1,749 | 981 | 618 | 135 | 999 | 1,651 | ||||||
| 2018 | 1,273 | 345 | 728 | 1,415 | 1,886 | 4,551 | 342 | 311 | 1,056 | 108 | ||
| 2019 | 761 | 302 | 394 | 1,142 | 189 | 1,218 | 1,844 | 647 | 1,528 | 1,322 | 813 | |
| 2020 | 2,325 | 1,895 | 1,534 | 1,756 | 398 | 291 | 183 | 908 | 357 | 743 | 382 | |
| 2021 | 367 | 400 | 600 | 474 | 1,133 | 415 | 925 | 286 | 346 | |||
| 2022 | 295 | 301 | 767 | 1,341 | 380 | 199 | 996 | 444 | 1,145 | 908 | ||
| 2023 | 1,035 | 209 | 352 | 454 | 343 | 596 | 380 | |||||
| 2024 | 189 | |||||||||||
| - = No Data Reported; -- = Not Applicable; NA = Not Available; W = Withheld to avoid disclosure of individual company data. |
| Release Date: 3/29/2024 |
| Next Release Date: 4/30/2024 |