|
Download Data (XLS File) |
|
||||||||
|
||||||||
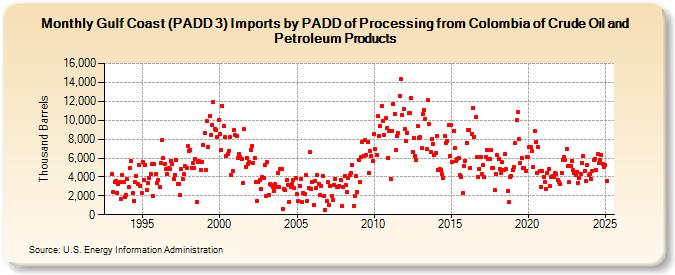
| Gulf Coast (PADD 3) Imports by PADD of Processing from Colombia of Crude Oil and Petroleum Products (Thousand Barrels) | ||||||||
| Year | Jan | Feb | Mar | Apr | May | Jun | Jul | Aug | Sep | Oct | Nov | Dec |
|---|---|---|---|---|---|---|---|---|---|---|---|---|
| 1993 | 4,311 | 2,454 | 3,502 | 3,589 | 2,334 | 3,227 | 3,508 | 1,681 | 4,214 | 3,477 | 1,927 | 2,099 |
| 1994 | 3,734 | 2,892 | 4,967 | 5,667 | 2,326 | 1,503 | 3,461 | 4,063 | 3,257 | 5,263 | 3,047 | 2,350 |
| 1995 | 5,583 | 3,621 | 5,250 | 2,603 | 3,306 | 3,899 | 4,294 | 5,378 | 2,028 | 5,375 | 4,311 | 3,310 |
| 1996 | 3,707 | 2,915 | 5,420 | 7,859 | 5,970 | 5,333 | 4,880 | 4,270 | 4,915 | 4,841 | 5,729 | 5,347 |
| 1997 | 3,737 | 4,243 | 5,810 | 3,199 | 3,268 | 2,086 | 4,787 | 3,811 | 4,305 | 5,103 | 4,920 | 7,239 |
| 1998 | 6,756 | 6,814 | 4,947 | 5,483 | 4,953 | 5,911 | 1,376 | 5,594 | 5,637 | 4,767 | 5,606 | 7,424 |
| 1999 | 8,639 | 4,778 | 9,896 | 7,126 | 10,405 | 8,464 | 9,532 | 11,917 | 9,020 | 8,964 | 8,197 | 10,071 |
| 2000 | 8,524 | 6,871 | 11,516 | 9,371 | 8,208 | 6,176 | 6,386 | 6,763 | 8,172 | 4,151 | 4,592 | 8,978 |
| 2001 | 8,384 | 8,347 | 5,948 | 6,435 | 6,145 | 5,850 | 3,316 | 9,054 | 5,091 | 6,050 | 5,326 | 5,628 |
| 2002 | 6,804 | 7,271 | 5,487 | 6,019 | 3,498 | 1,462 | 3,461 | 3,632 | 2,705 | 4,007 | 3,913 | 5,240 |
| 2003 | 2,006 | 5,554 | 2,099 | 3,197 | 3,142 | 2,968 | 2,551 | 3,197 | 2,891 | 4,371 | 2,916 | 4,820 |
| 2004 | 4,841 | 616 | 2,682 | 2,618 | 3,669 | 3,181 | 1,358 | 2,942 | 3,233 | 3,665 | 2,817 | 3,839 |
| 2005 | 2,186 | 1,473 | 3,065 | 3,799 | 1,362 | 2,321 | 2,203 | 4,220 | 1,447 | 2,834 | 6,639 | 2,749 |
| 2006 | 3,458 | 990 | 3,533 | 2,860 | 4,247 | 3,262 | 2,092 | 3,046 | 4,107 | 2,007 | 524 | 1,443 |
| 2007 | 3,507 | 983 | 3,032 | 2,023 | 1,552 | 3,189 | 3,741 | 2,976 | 2,917 | 3,089 | 3,707 | 895 |
| 2008 | 2,883 | 4,097 | 3,117 | 2,373 | 3,891 | 4,231 | 4,400 | 5,243 | 973 | 2,012 | 4,079 | 2,357 |
| 2009 | 5,826 | 3,513 | 6,057 | 7,715 | 6,260 | 7,890 | 6,344 | 7,644 | 4,429 | 6,751 | 6,185 | 5,695 |
| 2010 | 8,515 | 6,939 | 6,349 | 10,419 | 8,337 | 9,431 | 11,540 | 9,955 | 8,485 | 10,205 | 9,157 | 5,969 |
| 2011 | 8,845 | 3,800 | 8,886 | 11,737 | 10,697 | 6,879 | 8,322 | 8,598 | 12,595 | 14,352 | 10,503 | 11,161 |
| 2012 | 9,094 | 7,798 | 8,682 | 10,754 | 10,761 | 12,374 | 6,585 | 8,164 | 6,161 | 5,766 | 9,361 | 8,115 |
| 2013 | 8,171 | 7,097 | 10,649 | 11,059 | 10,112 | 6,915 | 12,097 | 9,612 | 6,686 | 8,038 | 7,476 | 6,355 |
| 2014 | 6,504 | 8,290 | 4,780 | 4,848 | 4,752 | 4,315 | 3,918 | 8,361 | 7,565 | 7,753 | 9,541 | 6,217 |
| 2015 | 9,523 | 5,567 | 8,881 | 7,049 | 5,679 | 5,845 | 5,970 | 4,174 | 4,025 | 2,311 | 5,181 | 5,727 |
| 2016 | 7,602 | 8,971 | 8,981 | 4,923 | 8,584 | 11,283 | 8,254 | 10,337 | 6,060 | 4,038 | 4,835 | 6,116 |
| 2017 | 4,331 | 5,237 | 3,986 | 6,065 | 6,833 | 5,906 | 5,929 | 6,799 | 4,987 | 4,942 | 2,587 | 4,359 |
| 2018 | 6,339 | 5,878 | 4,843 | 4,430 | 5,531 | 4,756 | 6,385 | 4,818 | 2,488 | 1,298 | 3,956 | 4,100 |
| 2019 | 4,707 | 4,997 | 7,639 | 9,974 | 10,818 | 8,024 | 5,478 | 6,014 | 4,971 | 4,921 | 4,675 | 6,117 |
| 2020 | 6,127 | 7,209 | 7,216 | 6,746 | 5,037 | 8,830 | 7,686 | 4,460 | 7,182 | 4,583 | 2,965 | 4,577 |
| 2021 | 4,026 | 3,498 | 2,763 | 4,421 | 4,876 | 3,072 | 3,996 | 4,111 | 3,978 | 4,451 | 4,349 | 3,639 |
| 2022 | 3,473 | 3,220 | 4,419 | 5,789 | 6,131 | 5,792 | 6,969 | 5,152 | 3,410 | 5,202 | 5,726 | 4,687 |
| 2023 | 4,423 | 4,170 | 4,571 | 3,322 | 3,851 | 4,346 | 5,502 | 6,259 | 4,614 | 3,606 | 5,238 | 4,208 |
| 2024 | 4,324 | |||||||||||
| - = No Data Reported; -- = Not Applicable; NA = Not Available; W = Withheld to avoid disclosure of individual company data. |
| Release Date: 3/29/2024 |
| Next Release Date: 4/30/2024 |