|
Download Data (XLS File) |
|
||||||||
|
||||||||
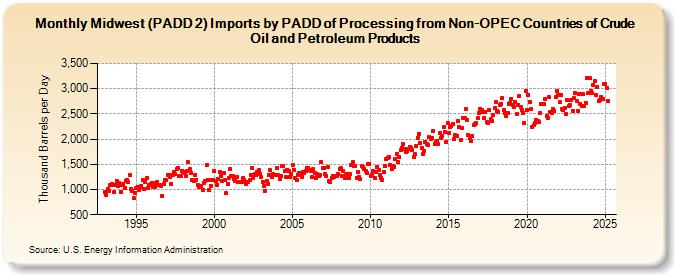
| Midwest (PADD 2) Imports by PADD of Processing from Non-OPEC Countries of Crude Oil and Petroleum Products (Thousand Barrels per Day) | ||||||||
| Year | Jan | Feb | Mar | Apr | May | Jun | Jul | Aug | Sep | Oct | Nov | Dec |
|---|---|---|---|---|---|---|---|---|---|---|---|---|
| 1993 | 952 | 899 | 1,020 | 980 | 1,082 | 1,116 | 1,088 | 946 | 1,099 | 1,176 | 1,062 | 1,124 |
| 1994 | 960 | 1,084 | 1,114 | 1,033 | 1,169 | 1,190 | 1,149 | 1,282 | 1,008 | 978 | 833 | 922 |
| 1995 | 1,026 | 1,058 | 993 | 1,049 | 1,076 | 1,183 | 1,004 | 1,155 | 1,237 | 1,030 | 1,090 | 1,113 |
| 1996 | 1,122 | 1,043 | 1,049 | 1,130 | 1,151 | 1,095 | 1,085 | 1,062 | 868 | 1,113 | 1,188 | 1,183 |
| 1997 | 1,283 | 1,287 | 1,251 | 1,105 | 1,279 | 1,355 | 1,304 | 1,404 | 1,422 | 1,261 | 1,274 | 1,363 |
| 1998 | 1,356 | 1,327 | 1,277 | 1,367 | 1,538 | 1,406 | 1,327 | 1,188 | 1,178 | 1,292 | 1,190 | 1,093 |
| 1999 | 1,047 | 1,056 | 1,067 | 998 | 1,125 | 1,167 | 1,482 | 1,198 | 986 | 1,070 | 1,184 | 1,182 |
| 2000 | 1,360 | 1,171 | 1,091 | 1,203 | 1,339 | 1,265 | 1,165 | 1,322 | 1,181 | 935 | 1,117 | 1,219 |
| 2001 | 1,416 | 1,267 | 1,269 | 1,207 | 1,174 | 1,240 | 1,151 | 1,154 | 1,155 | 1,142 | 1,225 | 1,189 |
| 2002 | 1,114 | 1,140 | 1,154 | 1,179 | 1,294 | 1,432 | 1,236 | 1,313 | 1,278 | 1,348 | 1,378 | 1,314 |
| 2003 | 1,239 | 1,157 | 1,075 | 971 | 1,177 | 1,115 | 1,297 | 1,380 | 1,244 | 1,304 | 1,295 | 1,293 |
| 2004 | 1,422 | 1,282 | 1,215 | 1,269 | 1,462 | 1,471 | 1,370 | 1,241 | 1,395 | 1,377 | 1,256 | 1,298 |
| 2005 | 1,481 | 1,394 | 1,230 | 1,193 | 1,283 | 1,332 | 1,319 | 1,257 | 1,355 | 1,324 | 1,373 | 1,423 |
| 2006 | 1,433 | 1,395 | 1,377 | 1,252 | 1,404 | 1,327 | 1,236 | 1,305 | 1,271 | 1,287 | 1,553 | 1,430 |
| 2007 | 1,425 | 1,298 | 1,272 | 1,441 | 1,176 | 1,142 | 1,235 | 1,260 | 1,256 | 1,263 | 1,273 | 1,313 |
| 2008 | 1,399 | 1,417 | 1,269 | 1,367 | 1,220 | 1,279 | 1,311 | 1,227 | 1,298 | 1,487 | 1,542 | 1,457 |
| 2009 | 1,466 | 1,238 | 1,352 | 1,255 | 1,199 | 1,465 | 1,451 | 1,409 | 1,363 | 1,326 | 1,500 | 1,513 |
| 2010 | 1,270 | 1,285 | 1,371 | 1,226 | 1,351 | 1,448 | 1,378 | 1,293 | 1,233 | 1,189 | 1,348 | 1,460 |
| 2011 | 1,603 | 1,629 | 1,643 | 1,485 | 1,397 | 1,466 | 1,450 | 1,606 | 1,706 | 1,553 | 1,643 | 1,782 |
| 2012 | 1,826 | 1,900 | 1,808 | 1,748 | 1,755 | 1,810 | 1,840 | 1,820 | 1,778 | 1,636 | 1,697 | 1,866 |
| 2013 | 2,028 | 2,102 | 1,920 | 1,826 | 1,705 | 1,758 | 1,948 | 1,911 | 1,874 | 2,040 | 2,002 | 2,028 |
| 2014 | 2,162 | 1,908 | 1,938 | 1,956 | 1,904 | 2,114 | 2,027 | 2,069 | 2,236 | 2,143 | 1,941 | 2,327 |
| 2015 | 2,128 | 2,248 | 2,256 | 2,295 | 1,996 | 2,086 | 2,071 | 2,359 | 2,232 | 1,982 | 2,225 | 2,419 |
| 2016 | 2,426 | 2,592 | 2,375 | 2,073 | 2,015 | 1,956 | 2,052 | 2,284 | 2,297 | 2,310 | 2,418 | 2,519 |
| 2017 | 2,600 | 2,574 | 2,533 | 2,411 | 2,547 | 2,333 | 2,326 | 2,571 | 2,402 | 2,360 | 2,485 | 2,609 |
| 2018 | 2,732 | 2,555 | 2,533 | 2,683 | 2,704 | 2,820 | 2,569 | 2,515 | 2,452 | 2,520 | 2,703 | 2,711 |
| 2019 | 2,805 | 2,675 | 2,640 | 2,728 | 2,495 | 2,684 | 2,856 | 2,643 | 2,586 | 2,526 | 2,319 | 2,947 |
| 2020 | 2,579 | 2,880 | 2,739 | 2,591 | 2,231 | 2,278 | 2,327 | 2,382 | 2,364 | 2,330 | 2,520 | 2,695 |
| 2021 | 2,695 | 2,687 | 2,791 | 2,453 | 2,427 | 2,829 | 2,546 | 2,519 | 2,605 | 2,553 | 2,837 | 2,953 |
| 2022 | 2,872 | 2,726 | 2,879 | 2,588 | 2,568 | 2,609 | 2,504 | 2,770 | 2,647 | 2,680 | 2,781 | 2,564 |
| 2023 | 2,807 | 2,911 | 2,757 | 2,559 | 2,904 | 2,702 | 2,651 | 2,886 | 2,651 | 2,715 | 3,221 | 2,911 |
| 2024 | 3,217 | 2,962 | 2,912 | 3,083 | 3,154 | 2,875 | ||||||
| - = No Data Reported; -- = Not Applicable; NA = Not Available; W = Withheld to avoid disclosure of individual company data. |
| Release Date: 8/30/2024 |
| Next Release Date: 9/30/2024 |