|
Download Data (XLS File) |
|
||||||||
|
||||||||
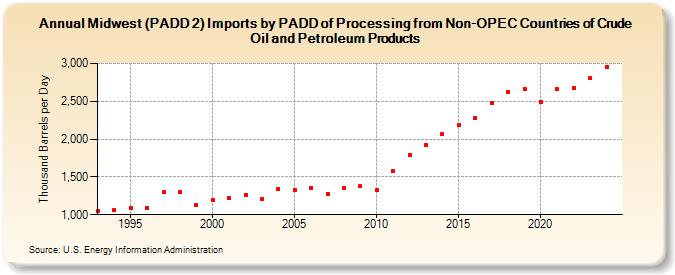
| Midwest (PADD 2) Imports by PADD of Processing from Non-OPEC Countries of Crude Oil and Petroleum Products (Thousand Barrels per Day) | ||||||||
| Decade | Year-0 | Year-1 | Year-2 | Year-3 | Year-4 | Year-5 | Year-6 | Year-7 | Year-8 | Year-9 |
|---|---|---|---|---|---|---|---|---|---|---|
| 1990's | 1,046 | 1,060 | 1,084 | 1,091 | 1,299 | 1,295 | 1,131 | |||
| 2000's | 1,197 | 1,216 | 1,265 | 1,213 | 1,339 | 1,330 | 1,356 | 1,279 | 1,356 | 1,379 |
| 2010's | 1,321 | 1,580 | 1,790 | 1,928 | 2,062 | 2,191 | 2,276 | 2,479 | 2,625 | 2,659 |
| 2020's | 2,491 | 2,657 | 2,682 | 2,806 |
| - = No Data Reported; -- = Not Applicable; NA = Not Available; W = Withheld to avoid disclosure of individual company data. |
| Release Date: 8/30/2024 |
| Next Release Date: 8/29/2025 |