|
Download Data (XLS File) |
|
||||||||
|
||||||||
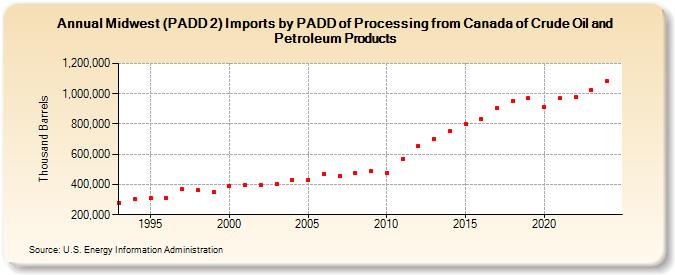
| Midwest (PADD 2) Imports by PADD of Processing from Canada of Crude Oil and Petroleum Products (Thousand Barrels) | ||||||||
| Decade | Year-0 | Year-1 | Year-2 | Year-3 | Year-4 | Year-5 | Year-6 | Year-7 | Year-8 | Year-9 |
|---|---|---|---|---|---|---|---|---|---|---|
| 1990's | 277,978 | 301,380 | 307,952 | 310,633 | 366,859 | 363,123 | 348,344 | |||
| 2000's | 391,600 | 393,210 | 395,130 | 402,305 | 430,709 | 428,452 | 470,205 | 455,833 | 476,860 | 488,617 |
| 2010's | 476,179 | 569,757 | 654,493 | 702,658 | 752,112 | 799,605 | 832,345 | 904,417 | 953,284 | 968,773 |
| 2020's | 911,747 | 968,761 | 978,986 | 1,072,635 |
| - = No Data Reported; -- = Not Applicable; NA = Not Available; W = Withheld to avoid disclosure of individual company data. |
| Release Date: 3/29/2024 |
| Next Release Date: 8/30/2024 |