|
Download Data (XLS File) |
|
||||||||
|
||||||||
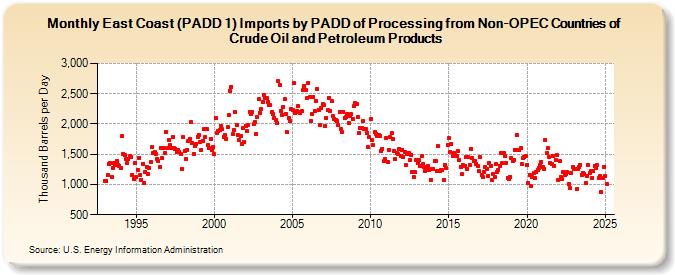
| East Coast (PADD 1) Imports by PADD of Processing from Non-OPEC Countries of Crude Oil and Petroleum Products (Thousand Barrels per Day) | ||||||||
| Year | Jan | Feb | Mar | Apr | May | Jun | Jul | Aug | Sep | Oct | Nov | Dec |
|---|---|---|---|---|---|---|---|---|---|---|---|---|
| 1993 | 1,065 | 1,056 | 1,151 | 1,339 | 1,359 | 1,127 | 1,268 | 1,361 | 1,314 | 1,382 | 1,329 | 1,311 |
| 1994 | 1,270 | 1,793 | 1,505 | 1,488 | 1,413 | 1,354 | 1,414 | 1,466 | 1,454 | 1,162 | 1,094 | 1,353 |
| 1995 | 1,122 | 1,234 | 1,441 | 1,159 | 1,078 | 1,343 | 1,022 | 1,204 | 1,293 | 1,179 | 1,280 | 1,364 |
| 1996 | 1,622 | 1,521 | 1,529 | 1,497 | 1,429 | 1,380 | 1,289 | 1,606 | 1,435 | 1,600 | 1,520 | 1,864 |
| 1997 | 1,598 | 1,735 | 1,646 | 1,607 | 1,781 | 1,604 | 1,589 | 1,533 | 1,568 | 1,543 | 1,511 | 1,260 |
| 1998 | 1,779 | 1,558 | 1,422 | 1,575 | 1,721 | 1,756 | 2,031 | 1,685 | 1,505 | 1,631 | 1,675 | 1,790 |
| 1999 | 1,815 | 1,705 | 1,573 | 1,719 | 1,923 | 1,783 | 1,920 | 1,647 | 1,596 | 1,753 | 1,576 | 1,612 |
| 2000 | 1,499 | 2,093 | 1,853 | 1,891 | 1,901 | 1,973 | 1,909 | 1,790 | 1,824 | 1,754 | 1,954 | 2,146 |
| 2001 | 2,546 | 2,613 | 1,828 | 1,899 | 2,190 | 1,981 | 1,825 | 1,737 | 1,801 | 1,676 | 1,933 | 1,706 |
| 2002 | 1,966 | 1,888 | 1,984 | 2,206 | 2,159 | 2,198 | 1,995 | 2,026 | 1,829 | 2,110 | 2,408 | 2,176 |
| 2003 | 2,248 | 2,371 | 2,474 | 2,434 | 2,434 | 2,366 | 2,316 | 2,307 | 2,195 | 2,162 | 2,092 | 2,068 |
| 2004 | 2,019 | 2,706 | 2,640 | 2,216 | 2,150 | 2,285 | 2,406 | 2,169 | 1,860 | 2,098 | 2,056 | 2,241 |
| 2005 | 2,227 | 2,677 | 2,178 | 2,213 | 2,289 | 2,198 | 2,183 | 2,207 | 2,554 | 2,632 | 2,558 | 2,426 |
| 2006 | 2,675 | 2,439 | 2,047 | 2,167 | 2,446 | 2,219 | 2,380 | 2,570 | 2,238 | 1,990 | 2,260 | 2,331 |
| 2007 | 2,313 | 1,961 | 2,099 | 2,225 | 2,430 | 2,215 | 2,372 | 2,128 | 2,084 | 2,067 | 2,051 | 1,987 |
| 2008 | 2,203 | 1,918 | 1,864 | 2,204 | 2,096 | 2,111 | 2,171 | 2,012 | 2,127 | 2,160 | 2,079 | 2,289 |
| 2009 | 2,344 | 2,330 | 2,110 | 1,856 | 1,930 | 1,930 | 2,045 | 1,924 | 1,925 | 1,856 | 1,618 | 1,783 |
| 2010 | 2,081 | 1,731 | 1,648 | 1,867 | 1,836 | 1,809 | 1,818 | 1,805 | 1,546 | 1,592 | 1,381 | 1,418 |
| 2011 | 1,767 | 1,368 | 1,569 | 1,779 | 1,859 | 1,748 | 1,559 | 1,417 | 1,527 | 1,507 | 1,592 | 1,470 |
| 2012 | 1,573 | 1,452 | 1,540 | 1,316 | 1,506 | 1,524 | 1,399 | 1,492 | 1,204 | 1,123 | 1,198 | 1,411 |
| 2013 | 1,350 | 1,400 | 1,298 | 1,473 | 1,333 | 1,295 | 1,223 | 1,232 | 1,300 | 1,238 | 1,076 | 1,248 |
| 2014 | 1,251 | 1,388 | 1,384 | 1,220 | 1,631 | 1,215 | 1,247 | 1,236 | 1,073 | 1,328 | 1,274 | 1,648 |
| 2015 | 1,763 | 1,529 | 1,670 | 1,463 | 1,522 | 1,487 | 1,478 | 1,554 | 1,406 | 1,293 | 1,169 | 1,317 |
| 2016 | 1,307 | 1,451 | 1,258 | 1,457 | 1,319 | 1,587 | 1,440 | 1,391 | 1,387 | 1,339 | 1,305 | 1,218 |
| 2017 | 1,458 | 1,162 | 1,124 | 1,207 | 1,294 | 1,259 | 1,145 | 1,358 | 1,306 | 1,073 | 1,179 | 1,120 |
| 2018 | 1,341 | 1,199 | 1,247 | 1,312 | 1,518 | 1,349 | 1,524 | 1,468 | 1,360 | 1,115 | 1,091 | 1,129 |
| 2019 | 1,431 | 1,383 | 1,408 | 1,576 | 1,815 | 1,573 | 1,563 | 1,606 | 1,334 | 1,430 | 1,458 | 1,474 |
| 2020 | 1,328 | 1,027 | 1,158 | 968 | 1,117 | 1,185 | 1,099 | 1,204 | 1,236 | 1,274 | 1,318 | 1,376 |
| 2021 | 1,293 | 1,260 | 1,737 | 1,514 | 1,600 | 1,451 | 1,352 | 1,333 | 1,463 | 1,309 | 1,398 | 1,482 |
| 2022 | 1,076 | 1,380 | 1,117 | 1,083 | 1,214 | 1,163 | 1,172 | 1,201 | 1,011 | 938 | 1,193 | 1,292 |
| 2023 | 1,257 | 1,246 | 923 | 1,258 | 1,284 | 1,316 | 1,161 | 1,196 | 1,171 | 1,025 | 1,146 | 1,327 |
| 2024 | 1,192 | |||||||||||
| - = No Data Reported; -- = Not Applicable; NA = Not Available; W = Withheld to avoid disclosure of individual company data. |
| Release Date: 3/29/2024 |
| Next Release Date: 4/30/2024 |