|
Download Data (XLS File) |
|
||||||||
|
||||||||
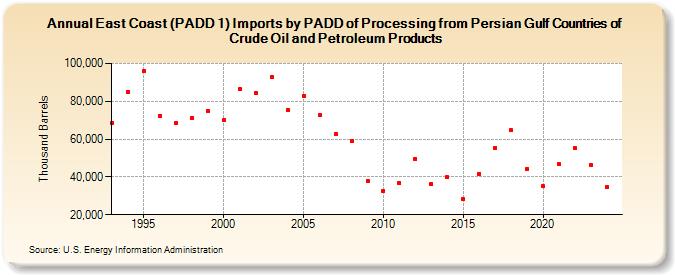
| East Coast (PADD 1) Imports by PADD of Processing from Persian Gulf Countries of Crude Oil and Petroleum Products (Thousand Barrels) | ||||||||
| Decade | Year-0 | Year-1 | Year-2 | Year-3 | Year-4 | Year-5 | Year-6 | Year-7 | Year-8 | Year-9 |
|---|---|---|---|---|---|---|---|---|---|---|
| 1990's | 68,628 | 85,176 | 95,760 | 72,318 | 68,382 | 71,355 | 74,876 | |||
| 2000's | 69,916 | 86,463 | 84,133 | 93,081 | 75,508 | 82,996 | 72,609 | 62,581 | 59,049 | 38,084 |
| 2010's | 32,645 | 36,655 | 49,578 | 36,276 | 39,750 | 28,276 | 41,779 | 55,367 | 64,564 | 44,304 |
| 2020's | 35,026 | 46,614 | 55,105 | 46,069 |
| - = No Data Reported; -- = Not Applicable; NA = Not Available; W = Withheld to avoid disclosure of individual company data. |
| Release Date: 3/29/2024 |
| Next Release Date: 8/30/2024 |