|
Download Data (XLS File) |
|
||||||||
|
||||||||
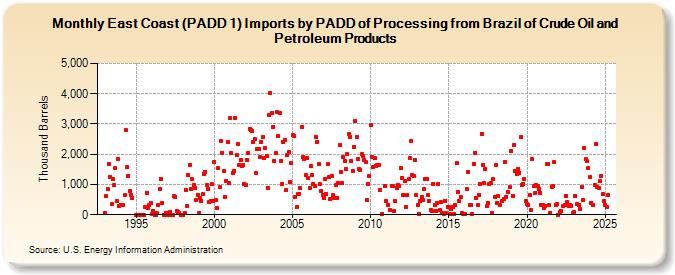
| East Coast (PADD 1) Imports by PADD of Processing from Brazil of Crude Oil and Petroleum Products (Thousand Barrels) | ||||||||
| Year | Jan | Feb | Mar | Apr | May | Jun | Jul | Aug | Sep | Oct | Nov | Dec |
|---|---|---|---|---|---|---|---|---|---|---|---|---|
| 1993 | 48 | 621 | 849 | 1,672 | 1,248 | 341 | 1,186 | 981 | 1,530 | 441 | 1,834 | 300 |
| 1994 | 332 | 335 | 319 | 649 | 2,791 | 1,581 | 1,291 | 797 | 639 | 558 | ||
| 1995 | 0 | 0 | 0 | 0 | 0 | 0 | 0 | 250 | 726 | 238 | 315 | 383 |
| 1996 | 33 | 120 | 0 | 0 | 48 | 312 | 834 | 1,181 | 386 | 0 | 0 | 67 |
| 1997 | 0 | 0 | 77 | 0 | 0 | 610 | 590 | 111 | 81 | 53 | 0 | 0 |
| 1998 | 0 | 64 | 824 | 285 | 1,312 | 1,657 | 861 | 1,172 | 975 | 878 | 479 | 667 |
| 1999 | 53 | 539 | 463 | 684 | 1,349 | 1,424 | 967 | 866 | 430 | 455 | 1,007 | 442 |
| 2000 | 1,753 | 492 | 219 | 1,535 | 903 | 2,422 | 2,039 | 1,429 | 590 | 1,127 | 2,399 | 1,064 |
| 2001 | 3,186 | 2,041 | 1,379 | 1,456 | 3,207 | 1,958 | 2,341 | 1,646 | 1,817 | 1,615 | 1,652 | 1,011 |
| 2002 | 968 | 1,800 | 2,053 | 2,834 | 2,794 | 2,758 | 2,395 | 2,501 | 1,382 | 2,164 | 2,186 | 1,901 |
| 2003 | 2,389 | 2,556 | 1,877 | 2,216 | 1,950 | 899 | 3,288 | 4,023 | 3,370 | 2,896 | 1,771 | 2,031 |
| 2004 | 3,395 | 2,592 | 3,368 | 1,765 | 1,014 | 2,392 | 2,483 | 810 | 1,981 | 2,061 | 1,070 | 1,709 |
| 2005 | 2,638 | 2,614 | 586 | 247 | 676 | 701 | 871 | 2,907 | 1,923 | 1,842 | 1,315 | 1,880 |
| 2006 | 1,202 | 895 | 1,608 | 1,320 | 1,030 | 949 | 2,571 | 2,408 | 1,686 | 1,003 | 800 | 647 |
| 2007 | 537 | 1,187 | 686 | 1,663 | 1,251 | 533 | 1,286 | 651 | 555 | 968 | 551 | 1,050 |
| 2008 | 2,305 | 1,400 | 1,036 | 1,912 | 1,779 | 1,510 | 1,992 | 2,682 | 2,578 | 1,791 | 1,452 | 2,255 |
| 2009 | 3,096 | 2,571 | 1,839 | 1,521 | 1,489 | 1,995 | 1,945 | 1,795 | 1,746 | 483 | 1,030 | 1,269 |
| 2010 | 2,969 | 1,895 | 1,582 | 1,867 | 1,604 | 1,655 | 1,636 | 820 | 38 | 951 | ||
| 2011 | 445 | 318 | 147 | 957 | 954 | 131 | 456 | 896 | 978 | 945 | 1,557 | |
| 2012 | 1,227 | 654 | 1,125 | 267 | 668 | 1,195 | 1,882 | 2,436 | 1,325 | 1,292 | 1,808 | 651 |
| 2013 | 324 | 32 | 445 | 586 | 484 | 844 | 1,187 | 1,190 | 653 | 466 | 172 | 122 |
| 2014 | 1,028 | 329 | 110 | 372 | 1,031 | 146 | 414 | 55 | 35 | 466 | 49 | 271 |
| 2015 | 246 | 8 | 184 | 255 | 39 | 310 | 1,698 | 762 | 447 | 581 | 70 | 31 |
| 2016 | 33 | 837 | 1,422 | 329 | 315 | 37 | 1,693 | 2,052 | 563 | 316 | 645 | |
| 2017 | 1,004 | 2,684 | 1,655 | 1,036 | 1,523 | 286 | 387 | 1,022 | 1,033 | 69 | 1,168 | 590 |
| 2018 | 1,653 | 371 | 607 | 305 | 459 | 518 | 1,758 | 591 | 766 | 907 | ||
| 2019 | 2,100 | 614 | 2,300 | 1,442 | 1,334 | 1,519 | 1,392 | 2,580 | 968 | 1,021 | 1,187 | 469 |
| 2020 | 347 | 310 | 661 | 157 | 1,826 | 935 | 705 | 988 | 936 | 840 | 720 | 321 |
| 2021 | 316 | 234 | 298 | 1,669 | 1,679 | 321 | 65 | 925 | 941 | 1,748 | 313 | 340 |
| 2022 | 1 | 75 | 134 | 298 | 309 | 620 | 433 | 300 | 318 | 302 | 51 | |
| 2023 | 88 | 627 | 353 | 322 | 179 | 918 | 494 | 2,217 | 1,850 | 1,775 | 1,553 | |
| 2024 | 1,235 | |||||||||||
| - = No Data Reported; -- = Not Applicable; NA = Not Available; W = Withheld to avoid disclosure of individual company data. |
| Release Date: 3/29/2024 |
| Next Release Date: 4/30/2024 |