|
Download Data (XLS File) |
|
||||||||
|
||||||||
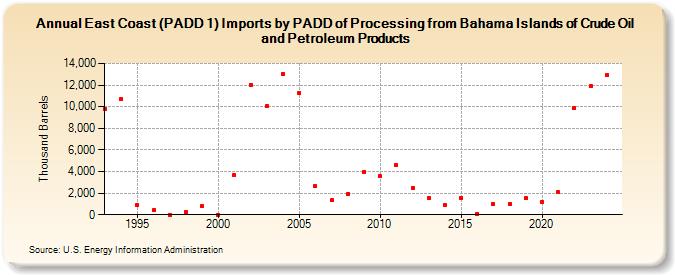
| East Coast (PADD 1) Imports by PADD of Processing from Bahama Islands of Crude Oil and Petroleum Products (Thousand Barrels) | ||||||||
| Decade | Year-0 | Year-1 | Year-2 | Year-3 | Year-4 | Year-5 | Year-6 | Year-7 | Year-8 | Year-9 |
|---|---|---|---|---|---|---|---|---|---|---|
| 1990's | 9,831 | 10,684 | 877 | 408 | 0 | 285 | 789 | |||
| 2000's | 0 | 3,696 | 12,036 | 10,061 | 13,031 | 11,251 | 2,618 | 1,325 | 1,933 | 3,945 |
| 2010's | 3,554 | 4,569 | 2,482 | 1,540 | 863 | 1,584 | 98 | 1,008 | 1,006 | 1,545 |
| 2020's | 1,223 | 2,070 | 9,921 | 11,889 |
| - = No Data Reported; -- = Not Applicable; NA = Not Available; W = Withheld to avoid disclosure of individual company data. |
| Release Date: 6/28/2024 |
| Next Release Date: 8/30/2024 |