|
Download Data (XLS File) |
|
||||||||
|
||||||||
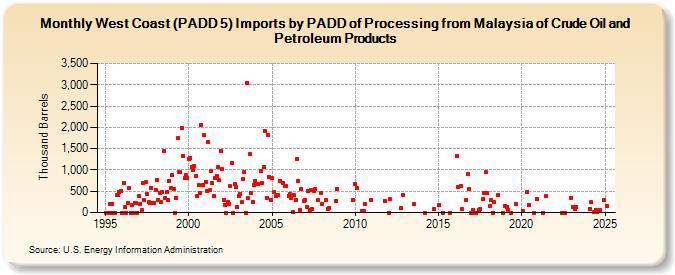
| West Coast (PADD 5) Imports by PADD of Processing from Malaysia of Crude Oil and Petroleum Products (Thousand Barrels) | ||||||||
| Year | Jan | Feb | Mar | Apr | May | Jun | Jul | Aug | Sep | Oct | Nov | Dec |
|---|---|---|---|---|---|---|---|---|---|---|---|---|
| 1995 | 0 | 0 | 0 | 201 | 0 | 199 | 0 | 0 | 407 | 405 | 472 | 515 |
| 1996 | 0 | 705 | 120 | 0 | 230 | 569 | 0 | 170 | 0 | 230 | 213 | 0 |
| 1997 | 386 | 208 | 56 | 699 | 291 | 707 | 431 | 241 | 233 | 579 | 230 | 229 |
| 1998 | 522 | 772 | 302 | 470 | 253 | 477 | 1,434 | 349 | 474 | 290 | 741 | 579 |
| 1999 | 881 | 557 | 0 | 338 | 1,749 | 944 | 943 | 1,996 | 1,329 | 808 | 893 | 803 |
| 2000 | 1,255 | 1,292 | 1,067 | 1,001 | 1,097 | 869 | 400 | 636 | 463 | 2,066 | 643 | 1,816 |
| 2001 | 727 | 513 | 1,654 | 529 | 968 | 705 | 397 | 818 | 869 | 1,059 | 755 | 1,447 |
| 2002 | 1,027 | 295 | 178 | 0 | 259 | 211 | 612 | 1,168 | 0 | 669 | 597 | 123 |
| 2003 | 386 | 425 | 249 | 799 | 959 | 0 | 3,038 | 336 | 1,380 | 455 | 256 | 649 |
| 2004 | 741 | 667 | 966 | 685 | 1,068 | 1,908 | 350 | 1,832 | 842 | 300 | ||
| 2005 | 805 | 475 | 386 | 418 | 741 | 697 | 628 | 618 | ||||
| 2006 | 390 | 431 | 342 | 9 | 403 | 295 | 1,254 | 731 | 70 | 549 | 282 | |
| 2007 | 289 | 131 | 510 | 60 | 526 | 76 | 515 | 559 | 284 | 455 | ||
| 2008 | 199 | 301 | 95 | 106 | 277 | 562 | ||||||
| 2009 | 289 | |||||||||||
| 2010 | 675 | 577 | 45 | 30 | 212 | 301 | ||||||
| 2011 | 279 | |||||||||||
| 2012 | 1 | 310 | 101 | 416 | ||||||||
| 2013 | 212 | |||||||||||
| 2014 | 1 | 83 | ||||||||||
| 2015 | 182 | 1 | 1 | |||||||||
| 2016 | 1,326 | 601 | 634 | 72 | 304 | 906 | 564 | 1 | ||||
| 2017 | 1 | 70 | 1 | 1 | 65 | 74 | 327 | 463 | 947 | 456 | ||
| 2018 | 151 | 289 | 1 | 241 | 412 | 1 | ||||||
| 2019 | 163 | 126 | 66 | 1 | 191 | |||||||
| 2020 | 32 | 486 | 184 | 1 | 320 | |||||||
| 2021 | 1 | 379 | ||||||||||
| 2022 | 1 | 1 | 350 | |||||||||
| 2023 | 131 | 77 | 119 | |||||||||
| - = No Data Reported; -- = Not Applicable; NA = Not Available; W = Withheld to avoid disclosure of individual company data. |
| Release Date: 3/29/2024 |
| Next Release Date: 4/30/2024 |