|
Download Data (XLS File) |
|
||||||||
|
||||||||
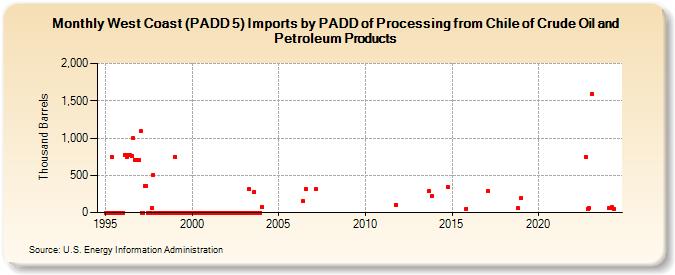
| West Coast (PADD 5) Imports by PADD of Processing from Chile of Crude Oil and Petroleum Products (Thousand Barrels) | ||||||||
| Year | Jan | Feb | Mar | Apr | May | Jun | Jul | Aug | Sep | Oct | Nov | Dec |
|---|---|---|---|---|---|---|---|---|---|---|---|---|
| 1995 | 0 | 0 | 0 | 0 | 751 | 0 | 0 | 0 | 0 | 0 | 0 | 0 |
| 1996 | 0 | 766 | 768 | 746 | 766 | 766 | 756 | 996 | 706 | 707 | 706 | 706 |
| 1997 | 1,091 | 0 | 0 | 358 | 361 | 0 | 0 | 0 | 63 | 506 | 0 | 0 |
| 1998 | 0 | 0 | 0 | 0 | 0 | 0 | 0 | 0 | 0 | 0 | 0 | 0 |
| 1999 | 749 | 0 | 0 | 0 | 0 | 0 | 0 | 0 | 0 | 0 | 0 | 0 |
| 2000 | 0 | 0 | 0 | 0 | 0 | 0 | 0 | 0 | 0 | 0 | 0 | 0 |
| 2001 | 0 | 0 | 0 | 0 | 0 | 0 | 0 | 0 | 0 | 0 | 0 | 0 |
| 2002 | 0 | 0 | 0 | 0 | 0 | 0 | 0 | 0 | 0 | 0 | 0 | 0 |
| 2003 | 0 | 0 | 0 | 312 | 0 | 0 | 0 | 281 | 0 | 0 | 0 | 0 |
| 2004 | 81 | |||||||||||
| 2006 | 151 | 314 | ||||||||||
| 2007 | 313 | |||||||||||
| 2011 | 107 | |||||||||||
| 2013 | 284 | 221 | ||||||||||
| 2014 | 343 | |||||||||||
| 2015 | 54 | |||||||||||
| 2017 | 283 | |||||||||||
| 2018 | 57 | |||||||||||
| 2019 | 193 | |||||||||||
| 2022 | 746 | 51 | 55 | |||||||||
| 2023 | 1,596 | |||||||||||
| - = No Data Reported; -- = Not Applicable; NA = Not Available; W = Withheld to avoid disclosure of individual company data. |
| Release Date: 3/29/2024 |
| Next Release Date: 4/30/2024 |