|
Download Data (XLS File) |
|
||||||||
|
||||||||
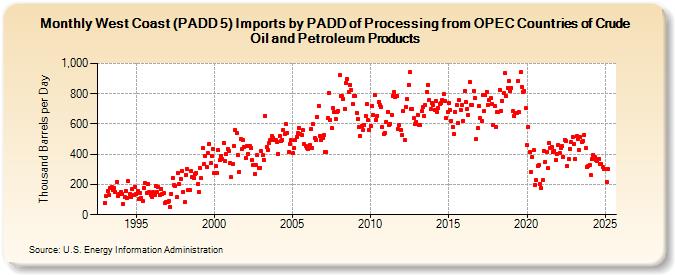
| West Coast (PADD 5) Imports by PADD of Processing from OPEC Countries of Crude Oil and Petroleum Products (Thousand Barrels per Day) | ||||||||
| Year | Jan | Feb | Mar | Apr | May | Jun | Jul | Aug | Sep | Oct | Nov | Dec |
|---|---|---|---|---|---|---|---|---|---|---|---|---|
| 1993 | 79 | 125 | 156 | 129 | 177 | 180 | 162 | 178 | 149 | 216 | 126 | 139 |
| 1994 | 147 | 138 | 74 | 114 | 154 | 111 | 220 | 136 | 118 | 169 | 128 | 182 |
| 1995 | 138 | 159 | 101 | 144 | 109 | 89 | 176 | 209 | 146 | 205 | 147 | 132 |
| 1996 | 116 | 147 | 133 | 188 | 151 | 181 | 129 | 172 | 135 | 143 | 77 | 81 |
| 1997 | 81 | 89 | 53 | 140 | 245 | 195 | 190 | 114 | 275 | 206 | 239 | 292 |
| 1998 | 153 | 84 | 260 | 304 | 162 | 162 | 287 | 251 | 242 | 268 | 276 | 202 |
| 1999 | 153 | 306 | 240 | 441 | 335 | 385 | 315 | 405 | 470 | 339 | 391 | 437 |
| 2000 | 278 | 323 | 273 | 426 | 362 | 391 | 368 | 477 | 355 | 402 | 436 | 424 |
| 2001 | 342 | 247 | 335 | 457 | 558 | 542 | 393 | 284 | 498 | 432 | 491 | 449 |
| 2002 | 374 | 453 | 404 | 456 | 443 | 359 | 332 | 272 | 327 | 392 | 308 | 312 |
| 2003 | 419 | 394 | 365 | 654 | 449 | 428 | 474 | 491 | 518 | 506 | 496 | 491 |
| 2004 | 484 | 402 | 519 | 486 | 497 | 561 | 533 | 597 | 541 | 414 | 468 | 492 |
| 2005 | 405 | 440 | 493 | 517 | 538 | 575 | 533 | 530 | 558 | 465 | 457 | 439 |
| 2006 | 435 | 458 | 568 | 444 | 600 | 505 | 493 | 648 | 722 | 521 | 495 | 506 |
| 2007 | 524 | 415 | 414 | 637 | 806 | 629 | 571 | 704 | 676 | 634 | 682 | 689 |
| 2008 | 921 | 785 | 783 | 767 | 700 | 873 | 897 | 812 | 858 | 826 | 733 | 787 |
| 2009 | 782 | 675 | 633 | 582 | 520 | 585 | 558 | 591 | 656 | 729 | 623 | 557 |
| 2010 | 586 | 722 | 659 | 789 | 627 | 654 | 745 | 723 | 711 | 579 | 531 | 542 |
| 2011 | 616 | 681 | 594 | 602 | 662 | 788 | 810 | 778 | 786 | 568 | 591 | 559 |
| 2012 | 528 | 685 | 497 | 714 | 764 | 861 | 942 | 702 | 698 | 637 | 598 | 614 |
| 2013 | 662 | 595 | 591 | 684 | 711 | 652 | 727 | 814 | 859 | 759 | 697 | 740 |
| 2014 | 723 | 695 | 755 | 676 | 707 | 733 | 738 | 757 | 796 | 752 | 638 | 677 |
| 2015 | 739 | 690 | 619 | 580 | 534 | 679 | 727 | 606 | 756 | 694 | 728 | 622 |
| 2016 | 818 | 746 | 701 | 659 | 879 | 728 | 724 | 820 | 775 | 498 | 571 | 719 |
| 2017 | 638 | 617 | 790 | 684 | 789 | 814 | 727 | 759 | 770 | 735 | 594 | 717 |
| 2018 | 579 | 681 | 681 | 825 | 688 | 754 | 803 | 936 | 784 | 841 | 887 | 816 |
| 2019 | 839 | 683 | 652 | 672 | 670 | 887 | 676 | 942 | 845 | 813 | 817 | 704 |
| 2020 | 460 | 580 | 415 | 281 | 381 | 425 | 198 | 228 | 325 | 326 | 202 | 176 |
| 2021 | 227 | 424 | 348 | 417 | 307 | 475 | 444 | 448 | 417 | 424 | 364 | 402 |
| 2022 | 459 | 411 | 442 | 452 | 382 | 496 | 488 | 321 | 366 | 437 | 479 | 514 |
| 2023 | 465 | 370 | 518 | 501 | 428 | 511 | 484 | 488 | 530 | 443 | 313 | 321 |
| 2024 | 332 | |||||||||||
| - = No Data Reported; -- = Not Applicable; NA = Not Available; W = Withheld to avoid disclosure of individual company data. |
| Release Date: 3/29/2024 |
| Next Release Date: 4/30/2024 |