|
Download Data (XLS File) |
|
||||||||
|
||||||||
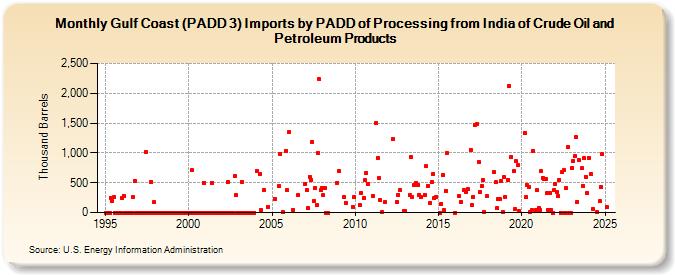
| Gulf Coast (PADD 3) Imports by PADD of Processing from India of Crude Oil and Petroleum Products (Thousand Barrels) | ||||||||
| Year | Jan | Feb | Mar | Apr | May | Jun | Jul | Aug | Sep | Oct | Nov | Dec |
|---|---|---|---|---|---|---|---|---|---|---|---|---|
| 1995 | 0 | 0 | 0 | 0 | 249 | 198 | 255 | 0 | 0 | 0 | 0 | 0 |
| 1996 | 250 | 284 | 0 | 0 | 0 | 0 | 0 | 0 | 255 | 532 | 0 | 0 |
| 1997 | 0 | 0 | 0 | 0 | 0 | 1,021 | 0 | 0 | 0 | 514 | 0 | 169 |
| 1998 | 0 | 0 | 0 | 0 | 0 | 0 | 0 | 0 | 0 | 0 | 0 | 0 |
| 1999 | 0 | 0 | 0 | 0 | 0 | 0 | 0 | 0 | 0 | 0 | 0 | 0 |
| 2000 | 0 | 0 | 708 | 0 | 0 | 0 | 0 | 0 | 0 | 0 | 0 | 504 |
| 2001 | 0 | 0 | 0 | 0 | 0 | 497 | 0 | 0 | 0 | 0 | 0 | 0 |
| 2002 | 0 | 0 | 0 | 0 | 516 | 0 | 0 | 0 | 0 | 613 | 292 | 0 |
| 2003 | 0 | 0 | 519 | 0 | 0 | 0 | 0 | 0 | 0 | 0 | 0 | 0 |
| 2004 | 697 | 644 | 36 | 377 | 101 | |||||||
| 2005 | 231 | 445 | 988 | 13 | 1,038 | 376 | ||||||
| 2006 | 1,345 | 50 | 293 | |||||||||
| 2007 | 483 | 379 | 70 | 603 | 542 | 1,184 | 198 | 420 | 119 | 1,000 | 2,234 | 375 |
| 2008 | 413 | 293 | 414 | 1 | 1 | 504 | ||||||
| 2009 | 700 | 265 | 167 | 100 | 254 | |||||||
| 2010 | 125 | 324 | 250 | 541 | 662 | 480 | ||||||
| 2011 | 275 | 1,503 | 919 | 575 | 213 | 14 | 175 | |||||
| 2012 | 1,237 | 174 | 302 | 373 | 34 | |||||||
| 2013 | 30 | 294 | 929 | 255 | 458 | 496 | 458 | 297 | 263 | |||
| 2014 | 300 | 775 | 452 | 164 | 518 | 644 | 250 | 253 | ||||
| 2015 | 1 | 150 | 629 | 40 | 369 | 995 | ||||||
| 2016 | 1 | 280 | 185 | 378 | 349 | 391 | 1,051 | |||||
| 2017 | 132 | 265 | 1,467 | 1,487 | 846 | 352 | 448 | 542 | 10 | 270 | ||
| 2018 | 680 | 506 | 70 | 224 | 221 | 524 | 7 | 598 | ||||
| 2019 | 259 | 547 | 2,130 | 940 | 694 | 54 | 860 | 790 | 29 | |||
| 2020 | 1,336 | 263 | 466 | 435 | 7 | 43 | 1,033 | 45 | 375 | |||
| 2021 | 74 | 45 | 692 | 587 | 562 | 557 | 321 | 45 | 335 | 45 | 1 | 370 |
| 2022 | 479 | 350 | 271 | 551 | 1 | 684 | 706 | 1 | 411 | 1,095 | 1 | 1 |
| 2023 | 747 | 868 | 941 | 1,267 | 185 | 884 | 743 | 453 | 908 | 603 | 331 | |
| 2024 | 922 | |||||||||||
| - = No Data Reported; -- = Not Applicable; NA = Not Available; W = Withheld to avoid disclosure of individual company data. |
| Release Date: 3/29/2024 |
| Next Release Date: 4/30/2024 |