|
Download Data (XLS File) |
|
||||||||
|
||||||||
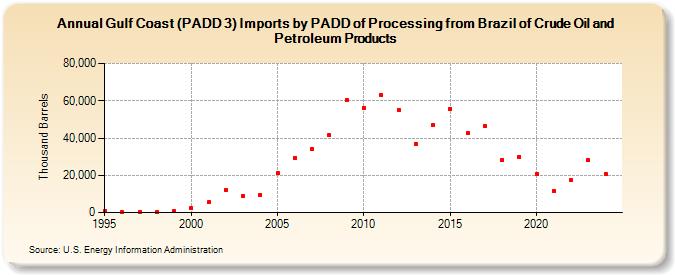
| Gulf Coast (PADD 3) Imports by PADD of Processing from Brazil of Crude Oil and Petroleum Products (Thousand Barrels) | ||||||||
| Decade | Year-0 | Year-1 | Year-2 | Year-3 | Year-4 | Year-5 | Year-6 | Year-7 | Year-8 | Year-9 |
|---|---|---|---|---|---|---|---|---|---|---|
| 1990's | 942 | 182 | 320 | 397 | 716 | |||||
| 2000's | 2,327 | 5,421 | 12,260 | 8,975 | 9,612 | 21,013 | 29,480 | 33,984 | 41,479 | 60,463 |
| 2010's | 56,114 | 63,270 | 55,161 | 36,971 | 46,936 | 55,736 | 42,676 | 46,235 | 28,429 | 29,914 |
| 2020's | 20,804 | 11,580 | 17,246 | 28,005 |
| - = No Data Reported; -- = Not Applicable; NA = Not Available; W = Withheld to avoid disclosure of individual company data. |
| Release Date: 3/29/2024 |
| Next Release Date: 8/30/2024 |