|
Download Data (XLS File) |
|
||||||||
|
||||||||
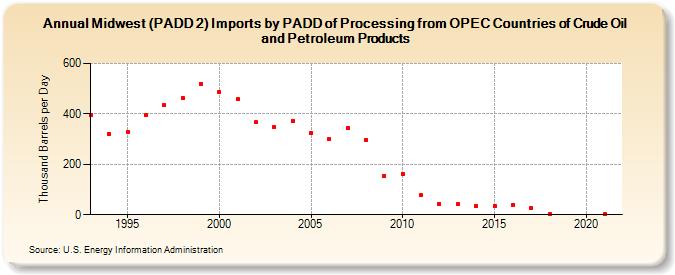
| Midwest (PADD 2) Imports by PADD of Processing from OPEC Countries of Crude Oil and Petroleum Products (Thousand Barrels per Day) | ||||||||
| Decade | Year-0 | Year-1 | Year-2 | Year-3 | Year-4 | Year-5 | Year-6 | Year-7 | Year-8 | Year-9 |
|---|---|---|---|---|---|---|---|---|---|---|
| 1990's | 396 | 320 | 329 | 394 | 435 | 463 | 520 | |||
| 2000's | 487 | 458 | 366 | 348 | 372 | 323 | 300 | 345 | 297 | 154 |
| 2010's | 162 | 77 | 43 | 41 | 34 | 34 | 39 | 26 | 1 | |
| 2020's | 1 |
| - = No Data Reported; -- = Not Applicable; NA = Not Available; W = Withheld to avoid disclosure of individual company data. |
| Release Date: 3/29/2024 |
| Next Release Date: 8/30/2024 |