|
Download Data (XLS File) |
|
||||||||
|
||||||||
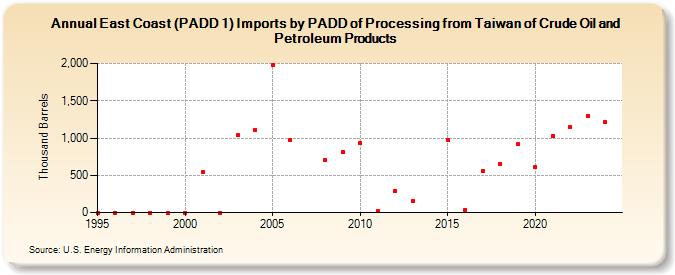
| East Coast (PADD 1) Imports by PADD of Processing from Taiwan of Crude Oil and Petroleum Products (Thousand Barrels) | ||||||||
| Decade | Year-0 | Year-1 | Year-2 | Year-3 | Year-4 | Year-5 | Year-6 | Year-7 | Year-8 | Year-9 |
|---|---|---|---|---|---|---|---|---|---|---|
| 1990's | 0 | 0 | 0 | 0 | 0 | |||||
| 2000's | 0 | 542 | 0 | 1,038 | 1,111 | 1,974 | 972 | 702 | 806 | |
| 2010's | 935 | 27 | 291 | 150 | 971 | 41 | 560 | 658 | 923 | |
| 2020's | 613 | 1,024 | 1,151 | 1,299 |
| - = No Data Reported; -- = Not Applicable; NA = Not Available; W = Withheld to avoid disclosure of individual company data. |
| Release Date: 3/29/2024 |
| Next Release Date: 8/30/2024 |