|
Download Data (XLS File) |
|
||||||||
|
||||||||
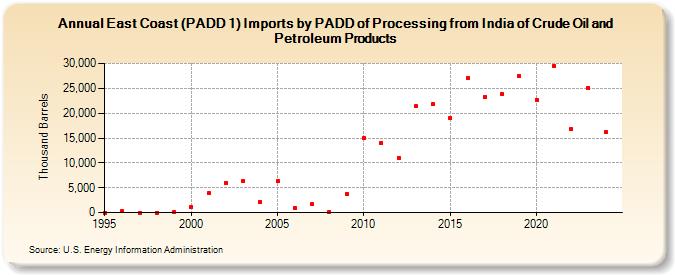
| East Coast (PADD 1) Imports by PADD of Processing from India of Crude Oil and Petroleum Products (Thousand Barrels) | ||||||||
| Decade | Year-0 | Year-1 | Year-2 | Year-3 | Year-4 | Year-5 | Year-6 | Year-7 | Year-8 | Year-9 |
|---|---|---|---|---|---|---|---|---|---|---|
| 1990's | 0 | 271 | 0 | 0 | 196 | |||||
| 2000's | 1,140 | 3,902 | 6,043 | 6,322 | 2,130 | 6,254 | 1,010 | 1,665 | 194 | 3,696 |
| 2010's | 15,045 | 13,972 | 11,035 | 21,370 | 21,759 | 19,033 | 27,100 | 23,262 | 23,906 | 27,469 |
| 2020's | 22,670 | 29,587 | 16,765 | 25,153 |
| - = No Data Reported; -- = Not Applicable; NA = Not Available; W = Withheld to avoid disclosure of individual company data. |
| Release Date: 3/29/2024 |
| Next Release Date: 8/30/2024 |