|
Download Data (XLS File) |
|
||||||||
|
||||||||
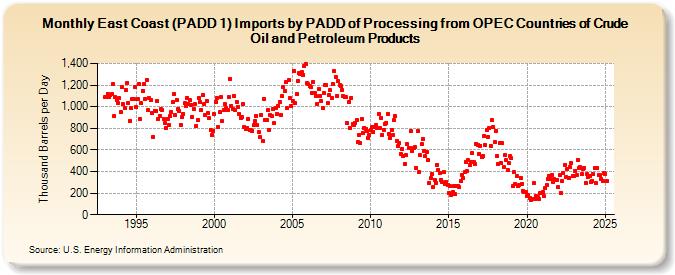
| East Coast (PADD 1) Imports by PADD of Processing from OPEC Countries of Crude Oil and Petroleum Products (Thousand Barrels per Day) | ||||||||
| Year | Jan | Feb | Mar | Apr | May | Jun | Jul | Aug | Sep | Oct | Nov | Dec |
|---|---|---|---|---|---|---|---|---|---|---|---|---|
| 1993 | 1,087 | 1,094 | 1,121 | 1,086 | 1,104 | 1,115 | 1,206 | 912 | 1,086 | 1,062 | 1,034 | 1,078 |
| 1994 | 949 | 1,180 | 1,021 | 985 | 1,155 | 1,222 | 1,034 | 869 | 985 | 1,070 | 1,075 | 1,186 |
| 1995 | 993 | 1,068 | 1,213 | 886 | 1,032 | 1,148 | 1,211 | 1,069 | 1,251 | 965 | 1,078 | 1,059 |
| 1996 | 940 | 724 | 961 | 963 | 1,052 | 888 | 918 | 979 | 967 | 887 | 845 | 799 |
| 1997 | 890 | 829 | 914 | 948 | 1,039 | 1,116 | 923 | 1,062 | 979 | 960 | 834 | 903 |
| 1998 | 936 | 1,031 | 1,004 | 1,081 | 1,023 | 1,063 | 1,020 | 908 | 979 | 1,024 | 823 | 876 |
| 1999 | 1,082 | 1,042 | 971 | 1,107 | 1,024 | 926 | 1,053 | 937 | 895 | 787 | 740 | 778 |
| 2000 | 928 | 1,041 | 1,082 | 810 | 947 | 1,087 | 867 | 972 | 1,022 | 990 | 970 | 1,092 |
| 2001 | 1,260 | 1,009 | 977 | 1,102 | 965 | 1,045 | 999 | 934 | 899 | 903 | 1,021 | 812 |
| 2002 | 794 | 804 | 889 | 782 | 780 | 778 | 826 | 869 | 914 | 828 | 766 | 722 |
| 2003 | 926 | 683 | 1,073 | 877 | 880 | 968 | 783 | 922 | 918 | 980 | 846 | 988 |
| 2004 | 932 | 1,009 | 1,048 | 927 | 1,098 | 1,182 | 1,148 | 1,228 | 985 | 1,246 | 1,080 | 1,002 |
| 2005 | 1,049 | 1,335 | 1,034 | 1,116 | 1,236 | 1,313 | 1,299 | 1,318 | 1,296 | 1,381 | 1,391 | 1,215 |
| 2006 | 1,206 | 1,191 | 1,186 | 1,129 | 1,229 | 1,128 | 1,096 | 1,028 | 1,160 | 1,102 | 1,050 | 987 |
| 2007 | 1,130 | 1,202 | 1,197 | 1,033 | 1,105 | 1,150 | 1,085 | 1,214 | 1,327 | 1,273 | 1,103 | 1,234 |
| 2008 | 1,200 | 1,189 | 1,155 | 1,098 | 1,090 | 1,088 | 848 | 1,044 | 804 | 1,081 | 838 | 833 |
| 2009 | 852 | 880 | 673 | 742 | 661 | 888 | 757 | 805 | 797 | 771 | 707 | 739 |
| 2010 | 782 | 810 | 764 | 808 | 830 | 803 | 934 | 802 | 896 | 739 | 781 | 839 |
| 2011 | 853 | 931 | 751 | 710 | 787 | 734 | 874 | 910 | 686 | 637 | 662 | 565 |
| 2012 | 612 | 539 | 473 | 552 | 650 | 617 | 618 | 772 | 589 | 621 | 625 | 436 |
| 2013 | 776 | 396 | 551 | 654 | 703 | 586 | 540 | 579 | 503 | 292 | 337 | 373 |
| 2014 | 257 | 324 | 291 | 464 | 414 | 389 | 324 | 302 | 395 | 281 | 304 | 273 |
| 2015 | 205 | 262 | 184 | 209 | 270 | 189 | 266 | 269 | 256 | 311 | 369 | 338 |
| 2016 | 393 | 492 | 401 | 502 | 462 | 492 | 571 | 490 | 471 | 657 | 649 | 563 |
| 2017 | 639 | 538 | 542 | 729 | 646 | 781 | 723 | 803 | 638 | 874 | 814 | 674 |
| 2018 | 779 | 542 | 470 | 668 | 482 | 661 | 444 | 550 | 511 | 418 | 478 | 541 |
| 2019 | 521 | 262 | 392 | 281 | 356 | 262 | 274 | 344 | 285 | 216 | 207 | 213 |
| 2020 | 175 | 178 | 153 | 139 | 148 | 289 | 148 | 171 | 161 | 142 | 198 | 199 |
| 2021 | 209 | 169 | 245 | 277 | 333 | 354 | 331 | 366 | 306 | 332 | 322 | 325 |
| 2022 | 256 | 367 | 203 | 312 | 385 | 463 | 351 | 424 | 343 | 442 | 475 | 359 |
| 2023 | 359 | 405 | 364 | 511 | 428 | 439 | 373 | 424 | 435 | 294 | 374 | 353 |
| 2024 | 354 | |||||||||||
| - = No Data Reported; -- = Not Applicable; NA = Not Available; W = Withheld to avoid disclosure of individual company data. |
| Release Date: 3/29/2024 |
| Next Release Date: 4/30/2024 |