|
Download Data (XLS File) |


|
||||||||
|
||||||||
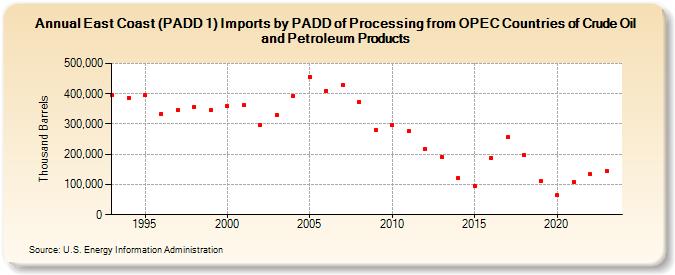
| East Coast (PADD 1) Imports by PADD of Processing from OPEC Countries of Crude Oil and Petroleum Products (Thousand Barrels) | ||||||||
| Decade | Year-0 | Year-1 | Year-2 | Year-3 | Year-4 | Year-5 | Year-6 | Year-7 | Year-8 | Year-9 |
|---|---|---|---|---|---|---|---|---|---|---|
| 1990's | 394,869 | 386,843 | 394,544 | 333,491 | 346,954 | 357,714 | 344,815 | |||
| 2000's | 360,076 | 362,568 | 296,711 | 330,455 | 393,259 | 455,352 | 410,257 | 427,354 | 374,098 | 281,605 |
| 2010's | 297,725 | 276,478 | 216,695 | 191,739 | 122,057 | 95,156 | 187,338 | 255,855 | 198,859 | 110,217 |
| 2020's | 63,974 | 108,895 | 133,098 | 144,523 |
| - = No Data Reported; -- = Not Applicable; NA = Not Available; W = Withheld to avoid disclosure of individual company data. |
| Release Date: 3/29/2024 |
| Next Release Date: 8/30/2024 |