|
Download Data (XLS File) |
|
||||||||
|
||||||||
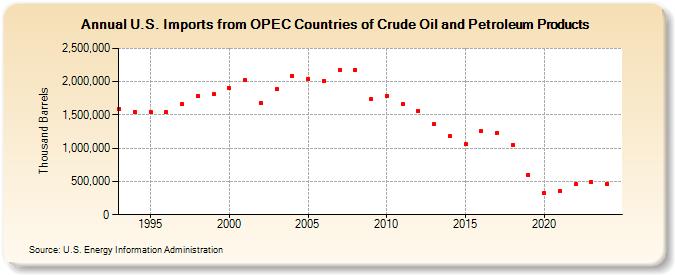
| U.S. Imports from OPEC Countries of Crude Oil and Petroleum Products (Thousand Barrels) | ||||||||
| Decade | Year-0 | Year-1 | Year-2 | Year-3 | Year-4 | Year-5 | Year-6 | Year-7 | Year-8 | Year-9 |
|---|---|---|---|---|---|---|---|---|---|---|
| 1990's | 1,589,348 | 1,550,153 | 1,544,232 | 1,541,303 | 1,667,525 | 1,790,434 | 1,807,788 | |||
| 2000's | 1,904,188 | 2,017,878 | 1,680,889 | 1,884,084 | 2,086,462 | 2,039,288 | 2,013,603 | 2,182,607 | 2,179,305 | 1,743,143 |
| 2010's | 1,790,811 | 1,662,720 | 1,563,273 | 1,357,907 | 1,181,458 | 1,056,471 | 1,261,076 | 1,228,526 | 1,054,004 | 598,212 |
| 2020's | 324,130 | 350,188 | 457,572 | 489,069 |
| - = No Data Reported; -- = Not Applicable; NA = Not Available; W = Withheld to avoid disclosure of individual company data. |
| Release Date: 3/29/2024 |
| Next Release Date: 8/30/2024 |