|
Download Data (XLS File) |
|
||||||||
|
||||||||
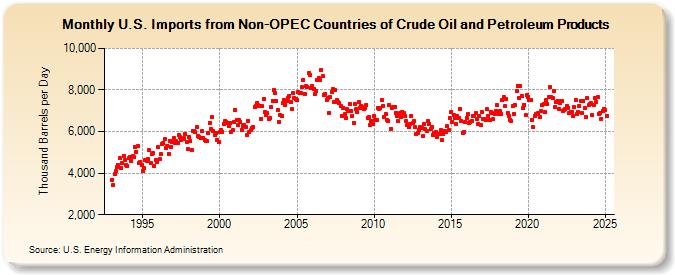
| U.S. Imports from Non-OPEC Countries of Crude Oil and Petroleum Products (Thousand Barrels per Day) | ||||||||
| Year | Jan | Feb | Mar | Apr | May | Jun | Jul | Aug | Sep | Oct | Nov | Dec |
|---|---|---|---|---|---|---|---|---|---|---|---|---|
| 1993 | 3,690 | 3,438 | 3,944 | 4,087 | 4,298 | 4,377 | 4,705 | 4,257 | 4,468 | 4,838 | 4,624 | 4,402 |
| 1994 | 4,333 | 4,705 | 4,784 | 4,561 | 4,805 | 4,787 | 5,273 | 5,007 | 5,307 | 4,484 | 4,536 | 4,411 |
| 1995 | 4,103 | 4,230 | 4,628 | 4,578 | 4,701 | 5,096 | 4,501 | 4,923 | 4,978 | 4,365 | 4,625 | 4,514 |
| 1996 | 5,244 | 4,660 | 4,932 | 5,421 | 5,465 | 5,663 | 5,201 | 5,321 | 4,938 | 5,566 | 5,277 | 5,487 |
| 1997 | 5,685 | 5,431 | 5,554 | 5,426 | 5,817 | 5,737 | 5,579 | 5,638 | 5,677 | 5,879 | 5,517 | 5,160 |
| 1998 | 5,745 | 5,522 | 5,119 | 6,048 | 6,046 | 5,970 | 6,242 | 5,785 | 5,746 | 5,680 | 6,023 | 5,698 |
| 1999 | 5,605 | 5,540 | 5,549 | 5,939 | 6,432 | 6,119 | 6,681 | 6,005 | 5,831 | 5,951 | 5,602 | 5,501 |
| 2000 | 5,971 | 6,095 | 5,997 | 6,387 | 6,512 | 6,474 | 6,410 | 6,268 | 6,430 | 5,983 | 6,073 | 6,478 |
| 2001 | 7,028 | 6,573 | 6,301 | 6,549 | 6,450 | 6,091 | 6,252 | 6,333 | 6,225 | 5,837 | 6,531 | 5,969 |
| 2002 | 6,059 | 6,171 | 6,207 | 7,160 | 7,208 | 7,397 | 7,258 | 7,252 | 6,622 | 7,207 | 7,586 | 6,935 |
| 2003 | 6,801 | 6,869 | 6,612 | 6,650 | 7,167 | 7,475 | 8,000 | 7,836 | 7,474 | 7,031 | 6,475 | 6,808 |
| 2004 | 6,770 | 7,372 | 7,516 | 7,290 | 7,491 | 7,626 | 7,725 | 7,432 | 7,063 | 7,858 | 7,625 | 7,555 |
| 2005 | 7,515 | 7,889 | 7,870 | 7,859 | 8,133 | 8,485 | 7,825 | 8,175 | 8,144 | 8,796 | 8,713 | 8,117 |
| 2006 | 8,200 | 8,063 | 7,816 | 7,950 | 8,495 | 8,562 | 8,474 | 8,967 | 8,648 | 7,779 | 7,823 | 7,500 |
| 2007 | 7,632 | 6,895 | 7,655 | 7,892 | 8,024 | 7,432 | 7,995 | 7,520 | 7,415 | 7,362 | 7,227 | 6,759 |
| 2008 | 7,153 | 6,826 | 6,664 | 7,069 | 6,971 | 7,344 | 6,999 | 6,727 | 6,435 | 7,328 | 7,082 | 6,928 |
| 2009 | 7,438 | 7,137 | 7,235 | 7,158 | 7,105 | 7,111 | 7,276 | 6,653 | 6,703 | 6,297 | 6,520 | 6,363 |
| 2010 | 6,747 | 6,571 | 6,538 | 7,149 | 7,087 | 7,146 | 7,497 | 7,239 | 6,712 | 6,837 | 6,571 | 6,518 |
| 2011 | 7,256 | 6,144 | 7,117 | 7,198 | 7,188 | 6,912 | 6,746 | 6,505 | 6,899 | 6,709 | 6,950 | 6,890 |
| 2012 | 6,751 | 6,501 | 6,304 | 6,208 | 6,387 | 6,769 | 6,407 | 6,495 | 6,203 | 5,860 | 5,953 | 6,088 |
| 2013 | 6,223 | 6,172 | 5,793 | 6,369 | 6,110 | 6,045 | 6,511 | 6,348 | 6,116 | 6,197 | 5,850 | 5,926 |
| 2014 | 5,955 | 5,757 | 5,861 | 5,893 | 6,074 | 5,585 | 5,897 | 6,044 | 5,964 | 6,247 | 6,088 | 6,642 |
| 2015 | 6,923 | 6,478 | 6,818 | 6,640 | 6,369 | 6,736 | 6,661 | 7,108 | 6,504 | 5,942 | 5,982 | 6,469 |
| 2016 | 6,653 | 6,836 | 6,425 | 6,468 | 6,516 | 6,751 | 6,763 | 6,895 | 6,624 | 6,369 | 6,732 | 6,302 |
| 2017 | 6,952 | 6,588 | 6,590 | 6,579 | 7,061 | 6,759 | 6,555 | 6,950 | 6,872 | 6,587 | 6,832 | 6,995 |
| 2018 | 7,271 | 6,846 | 6,977 | 6,852 | 7,496 | 7,685 | 7,222 | 7,577 | 6,893 | 6,739 | 6,569 | 6,505 |
| 2019 | 7,215 | 6,868 | 7,262 | 7,958 | 8,200 | 7,598 | 8,181 | 7,726 | 7,111 | 7,298 | 6,782 | 7,749 |
| 2020 | 7,654 | 7,499 | 7,530 | 6,567 | 6,230 | 6,751 | 6,831 | 6,843 | 6,891 | 6,689 | 6,983 | 7,271 |
| 2021 | 7,316 | 6,924 | 7,498 | 7,327 | 7,643 | 8,132 | 7,641 | 7,632 | 7,947 | 7,162 | 7,429 | 7,491 |
| 2022 | 7,081 | 7,357 | 7,471 | 7,009 | 7,014 | 7,071 | 7,241 | 7,135 | 6,906 | 6,939 | 6,958 | 6,736 |
| 2023 | 7,135 | 7,501 | 6,831 | 6,901 | 7,242 | 7,445 | 6,888 | 7,503 | 7,081 | 6,719 | 7,613 | 7,272 |
| 2024 | 7,347 | |||||||||||
| - = No Data Reported; -- = Not Applicable; NA = Not Available; W = Withheld to avoid disclosure of individual company data. |
| Release Date: 3/29/2024 |
| Next Release Date: 4/30/2024 |