|
Download Data (XLS File) |
|
||||||||
|
||||||||
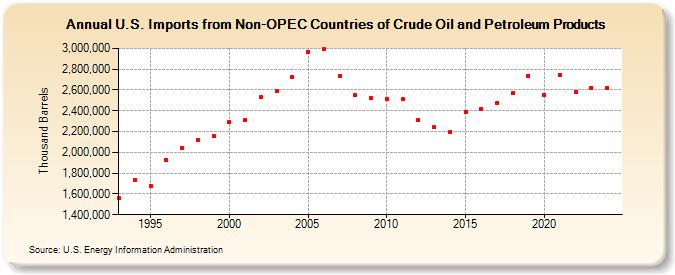
| U.S. Imports from Non-OPEC Countries of Crude Oil and Petroleum Products (Thousand Barrels) | ||||||||
| Decade | Year-0 | Year-1 | Year-2 | Year-3 | Year-4 | Year-5 | Year-6 | Year-7 | Year-8 | Year-9 |
|---|---|---|---|---|---|---|---|---|---|---|
| 1990's | 1,557,106 | 1,733,468 | 1,680,521 | 1,927,825 | 2,041,445 | 2,118,012 | 2,153,286 | |||
| 2000's | 2,289,898 | 2,315,160 | 2,527,649 | 2,592,417 | 2,724,642 | 2,966,253 | 2,989,479 | 2,733,350 | 2,547,689 | 2,523,967 |
| 2010's | 2,513,722 | 2,511,490 | 2,315,579 | 2,240,547 | 2,191,446 | 2,392,263 | 2,419,151 | 2,474,114 | 2,575,038 | 2,738,351 |
| 2020's | 2,553,760 | 2,742,790 | 2,582,448 | 2,618,502 |
| - = No Data Reported; -- = Not Applicable; NA = Not Available; W = Withheld to avoid disclosure of individual company data. |
| Release Date: 6/28/2024 |
| Next Release Date: 8/30/2024 |