|
Download Data (XLS File) |
|
||||||||
|
||||||||
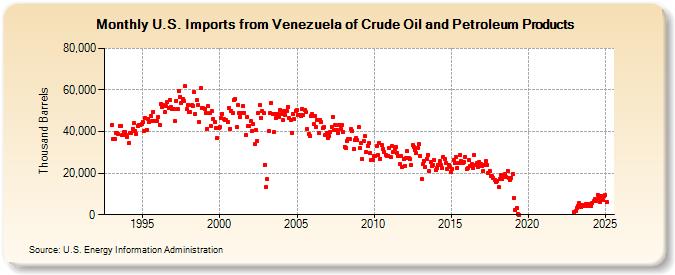
| U.S. Imports from Venezuela of Crude Oil and Petroleum Products (Thousand Barrels) | ||||||||
| Year | Jan | Feb | Mar | Apr | May | Jun | Jul | Aug | Sep | Oct | Nov | Dec |
|---|---|---|---|---|---|---|---|---|---|---|---|---|
| 1993 | 43,317 | 36,275 | 36,375 | 39,425 | 39,187 | 38,756 | 42,905 | 42,875 | 38,180 | 39,564 | 39,661 | 38,127 |
| 1994 | 37,552 | 34,283 | 39,077 | 39,090 | 41,363 | 44,078 | 40,188 | 38,897 | 42,831 | 42,939 | 42,959 | 43,551 |
| 1995 | 44,689 | 40,294 | 46,467 | 40,940 | 45,894 | 44,358 | 47,607 | 44,929 | 49,639 | 45,047 | 45,215 | 45,217 |
| 1996 | 47,072 | 43,346 | 53,289 | 51,948 | 52,704 | 49,261 | 52,402 | 54,223 | 51,242 | 55,214 | 51,846 | 50,863 |
| 1997 | 50,860 | 44,841 | 54,833 | 50,836 | 59,723 | 56,776 | 53,888 | 55,624 | 54,647 | 61,736 | 50,672 | 52,659 |
| 1998 | 49,494 | 49,389 | 52,645 | 52,301 | 59,234 | 48,473 | 55,134 | 52,792 | 44,687 | 60,845 | 51,233 | 51,189 |
| 1999 | 50,879 | 49,017 | 41,246 | 52,107 | 48,806 | 42,789 | 49,647 | 45,872 | 44,506 | 41,537 | 36,662 | 41,730 |
| 2000 | 42,173 | 46,400 | 48,592 | 46,118 | 45,503 | 45,478 | 44,833 | 51,499 | 41,351 | 49,915 | 48,954 | 55,049 |
| 2001 | 55,668 | 42,009 | 52,761 | 48,702 | 46,948 | 48,689 | 52,241 | 49,152 | 38,457 | 46,845 | 42,687 | 42,837 |
| 2002 | 44,948 | 40,435 | 43,523 | 34,010 | 40,674 | 35,651 | 49,144 | 52,664 | 46,684 | 49,762 | 48,735 | 24,132 |
| 2003 | 13,198 | 17,171 | 40,222 | 48,774 | 53,858 | 48,650 | 39,653 | 48,499 | 46,419 | 48,472 | 46,859 | 50,553 |
| 2004 | 48,442 | 45,382 | 49,893 | 47,955 | 49,682 | 51,693 | 46,341 | 45,697 | 39,408 | 48,382 | 45,966 | 50,103 |
| 2005 | 50,285 | 47,877 | 47,919 | 47,438 | 51,082 | 47,997 | 50,594 | 49,620 | 41,207 | 38,895 | 37,754 | 47,489 |
| 2006 | 48,538 | 43,470 | 47,507 | 42,006 | 45,567 | 39,188 | 45,526 | 44,617 | 41,584 | 42,035 | 38,421 | 39,488 |
| 2007 | 37,055 | 38,087 | 39,903 | 42,355 | 47,184 | 40,922 | 43,372 | 40,924 | 39,437 | 43,015 | 41,429 | 43,001 |
| 2008 | 39,569 | 32,810 | 32,009 | 35,672 | 36,304 | 36,436 | 41,206 | 40,459 | 31,543 | 36,018 | 37,071 | 35,932 |
| 2009 | 41,950 | 31,905 | 34,274 | 26,725 | 35,364 | 37,686 | 30,252 | 33,178 | 34,392 | 29,619 | 26,205 | 26,306 |
| 2010 | 28,232 | 28,285 | 32,878 | 28,523 | 34,635 | 26,976 | 33,590 | 31,669 | 30,235 | 28,828 | 28,245 | 28,430 |
| 2011 | 31,924 | 27,701 | 33,024 | 30,260 | 31,482 | 32,519 | 29,576 | 28,328 | 24,181 | 28,072 | 23,008 | 26,914 |
| 2012 | 23,293 | 27,088 | 30,496 | 27,134 | 26,683 | 23,829 | 33,469 | 32,478 | 31,141 | 29,494 | 32,275 | 33,840 |
| 2013 | 28,310 | 17,205 | 24,202 | 25,966 | 22,896 | 26,958 | 28,936 | 21,021 | 25,122 | 23,518 | 23,869 | 26,256 |
| 2014 | 21,290 | 22,592 | 23,926 | 25,600 | 23,922 | 22,448 | 27,946 | 26,874 | 24,721 | 21,753 | 23,994 | 23,061 |
| 2015 | 20,781 | 21,921 | 26,326 | 24,734 | 27,834 | 22,697 | 25,054 | 28,959 | 25,658 | 24,877 | 25,281 | 27,867 |
| 2016 | 21,748 | 22,431 | 26,228 | 23,654 | 24,400 | 22,439 | 28,936 | 23,962 | 24,760 | 22,976 | 25,461 | 24,466 |
| 2017 | 23,227 | 21,022 | 23,684 | 25,698 | 23,763 | 19,901 | 21,259 | 18,786 | 18,601 | 17,419 | 16,727 | 15,893 |
| 2018 | 16,379 | 13,210 | 17,377 | 18,945 | 17,315 | 19,303 | 19,386 | 18,345 | 21,228 | 17,672 | 16,889 | 17,846 |
| 2019 | 19,648 | 8,096 | 2,143 | 3,429 | 343 | 7 | ||||||
| 2023 | 1,241 | 1,630 | 3,383 | 4,210 | 5,727 | 3,774 | 4,739 | 4,509 | 4,884 | 5,140 | 4,423 | 5,082 |
| 2024 | 4,928 | |||||||||||
| - = No Data Reported; -- = Not Applicable; NA = Not Available; W = Withheld to avoid disclosure of individual company data. |
| Release Date: 3/29/2024 |
| Next Release Date: 4/30/2024 |