|
Download Data (XLS File) |
|
||||||||
|
||||||||
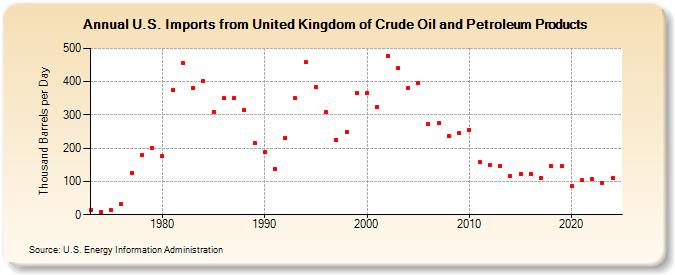
| U.S. Imports from United Kingdom of Crude Oil and Petroleum Products (Thousand Barrels per Day) | ||||||||
| Decade | Year-0 | Year-1 | Year-2 | Year-3 | Year-4 | Year-5 | Year-6 | Year-7 | Year-8 | Year-9 |
|---|---|---|---|---|---|---|---|---|---|---|
| 1970's | 15 | 8 | 14 | 31 | 126 | 180 | 202 | |||
| 1980's | 176 | 375 | 456 | 382 | 402 | 310 | 350 | 352 | 315 | 215 |
| 1990's | 189 | 138 | 230 | 350 | 458 | 383 | 308 | 226 | 250 | 365 |
| 2000's | 366 | 324 | 478 | 440 | 380 | 396 | 272 | 277 | 236 | 245 |
| 2010's | 256 | 159 | 149 | 147 | 117 | 123 | 122 | 111 | 146 | 146 |
| 2020's | 85 | 104 | 106 | 95 |
| - = No Data Reported; -- = Not Applicable; NA = Not Available; W = Withheld to avoid disclosure of individual company data. |
| Release Date: 6/28/2024 |
| Next Release Date: 8/30/2024 |