|
Download Data (XLS File) |
|
||||||||
|
||||||||
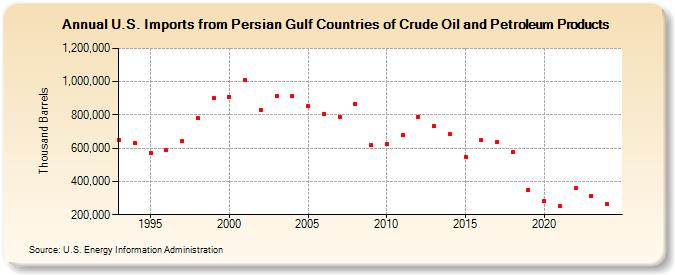
| U.S. Imports from Persian Gulf Countries of Crude Oil and Petroleum Products (Thousand Barrels) | ||||||||
| Decade | Year-0 | Year-1 | Year-2 | Year-3 | Year-4 | Year-5 | Year-6 | Year-7 | Year-8 | Year-9 |
|---|---|---|---|---|---|---|---|---|---|---|
| 1990's | 650,273 | 630,731 | 574,032 | 587,003 | 640,470 | 779,627 | 899,241 | |||
| 2000's | 910,598 | 1,007,807 | 828,226 | 912,749 | 912,447 | 851,855 | 807,172 | 789,607 | 867,559 | 616,371 |
| 2010's | 624,638 | 679,403 | 789,082 | 733,325 | 684,235 | 549,906 | 646,535 | 637,330 | 575,807 | 351,417 |
| 2020's | 280,288 | 252,155 | 358,050 | 314,085 | 261,508 |
| - = No Data Reported; -- = Not Applicable; NA = Not Available; W = Withheld to avoid disclosure of individual company data. |
| Release Date: 6/30/2025 |
| Next Release Date: 8/29/2025 |