|
Download Data (XLS File) |
|
||||||||
|
||||||||
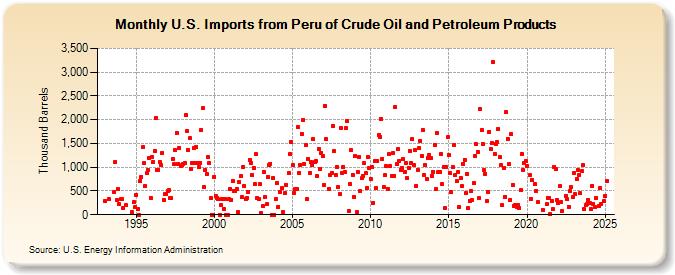
| U.S. Imports from Peru of Crude Oil and Petroleum Products (Thousand Barrels) | ||||||||
| Year | Jan | Feb | Mar | Apr | May | Jun | Jul | Aug | Sep | Oct | Nov | Dec |
|---|---|---|---|---|---|---|---|---|---|---|---|---|
| 1993 | 299 | 328 | 487 | 1,110 | 311 | 544 | 218 | |||||
| 1994 | 331 | 322 | 150 | 194 | 50 | 258 | 157 | |||||
| 1995 | 410 | 111 | 0 | 719 | 804 | 1,419 | 1,092 | 603 | 871 | 950 | 1,190 | 361 |
| 1996 | 1,221 | 1,114 | 1,347 | 2,038 | 945 | 947 | 1,115 | 1,039 | 1,302 | 317 | 430 | 441 |
| 1997 | 494 | 516 | 355 | 357 | 1,177 | 1,063 | 1,362 | 1,728 | 1,063 | 1,414 | 1,021 | 1,046 |
| 1998 | 1,074 | 1,085 | 2,088 | 1,768 | 1,357 | 1,609 | 972 | 1,084 | 1,413 | 1,090 | 1,432 | 1,088 |
| 1999 | 1,002 | 1,090 | 1,779 | 2,237 | 580 | 941 | 851 | 1,208 | 1,079 | 350 | 0 | 0 |
| 2000 | 804 | 391 | 362 | 325 | 0 | 200 | 328 | 125 | 326 | 0 | 0 | 329 |
| 2001 | 549 | 316 | 712 | 507 | 503 | 542 | 51 | 692 | 811 | 380 | 1,009 | 603 |
| 2002 | 327 | 358 | 478 | 1,158 | 1,080 | 832 | 990 | 645 | 1,269 | 350 | 330 | 637 |
| 2003 | 37 | 182 | 909 | 368 | 220 | 799 | 1,037 | 1,076 | 0 | 773 | 0 | 329 |
| 2004 | 663 | 168 | 471 | 552 | 54 | 451 | 632 | 877 | 1,270 | 1,534 | ||
| 2005 | 1,051 | 462 | 532 | 549 | 1,846 | 885 | 1,049 | 1,705 | 1,999 | 1,067 | 1,457 | 322 |
| 2006 | 1,169 | 880 | 1,119 | 1,048 | 1,587 | 1,105 | 1,137 | 816 | 1,393 | 952 | 1,304 | 1,227 |
| 2007 | 631 | 2,297 | 1,593 | 550 | 841 | 884 | 1,871 | 1,335 | 829 | 1,014 | 582 | |
| 2008 | 429 | 1,834 | 884 | 1,006 | 901 | 1,829 | 1,973 | 79 | 653 | 1,358 | 844 | 382 |
| 2009 | 1,244 | 50 | 905 | 1,219 | 492 | 767 | 819 | 1,078 | 871 | 556 | 1,224 | 978 |
| 2010 | 749 | 1,004 | 254 | 1,125 | 555 | 1,138 | 1,676 | 1,642 | 2,018 | 1,175 | 588 | 826 |
| 2011 | 1,020 | 549 | 1,275 | 1,018 | 823 | 1,300 | 819 | 2,270 | 1,067 | 1,381 | 1,138 | 943 |
| 2012 | 988 | 1,165 | 906 | 1,085 | 770 | 991 | 1,340 | 1,095 | 1,587 | 1,041 | 1,360 | 606 |
| 2013 | 951 | 1,405 | 1,559 | 1,236 | 1,782 | 845 | 1,044 | 760 | 1,192 | 1,257 | 1,203 | 822 |
| 2014 | 909 | 1,475 | 550 | 1,718 | 907 | 897 | 1,282 | 641 | 1,010 | 150 | 1,010 | 1,627 |
| 2015 | 1,259 | 875 | 472 | 1,006 | 1,476 | 841 | 711 | 901 | 160 | 782 | 601 | 1,077 |
| 2016 | 1,157 | 447 | 852 | 131 | 289 | 490 | 300 | 666 | 1,243 | 1,483 | 1,329 | 349 |
| 2017 | 2,221 | 1,781 | 1,488 | 937 | 867 | 281 | 479 | 1,751 | 1,374 | 1,514 | 3,205 | 1,279 |
| 2018 | 1,483 | 1,520 | 1,800 | 1,210 | 1,047 | 198 | 975 | 383 | 2,158 | 1,601 | 1,061 | 320 |
| 2019 | 1,695 | 631 | 189 | 207 | 160 | 213 | 140 | 511 | 1,283 | 940 | 1,079 | 1,130 |
| 2020 | 1,030 | 826 | 339 | 728 | 647 | 500 | 261 | |||||
| 2021 | 105 | 224 | 361 | 346 | 6 | 284 | 114 | 1,005 | 959 | 311 | ||
| 2022 | 251 | 603 | 259 | 80 | 399 | 321 | 171 | 498 | 576 | 372 | ||
| 2023 | 880 | 435 | 751 | 942 | 843 | 450 | 914 | 1,037 | 110 | 201 | 219 | 319 |
| 2024 | 247 | |||||||||||
| - = No Data Reported; -- = Not Applicable; NA = Not Available; W = Withheld to avoid disclosure of individual company data. |
| Release Date: 3/29/2024 |
| Next Release Date: 4/30/2024 |