|
Download Data (XLS File) |
|
||||||||
|
||||||||
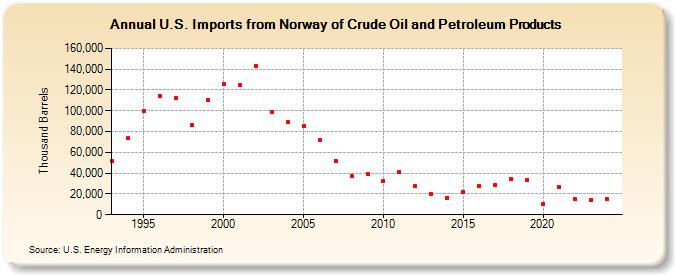
| U.S. Imports from Norway of Crude Oil and Petroleum Products (Thousand Barrels) | ||||||||
| Decade | Year-0 | Year-1 | Year-2 | Year-3 | Year-4 | Year-5 | Year-6 | Year-7 | Year-8 | Year-9 |
|---|---|---|---|---|---|---|---|---|---|---|
| 1990's | 51,862 | 73,637 | 99,803 | 114,523 | 112,733 | 86,180 | 110,794 | |||
| 2000's | 125,719 | 124,542 | 143,336 | 98,565 | 89,374 | 85,197 | 71,603 | 51,970 | 37,303 | 39,389 |
| 2010's | 32,634 | 41,259 | 27,598 | 19,729 | 16,559 | 22,141 | 27,841 | 28,780 | 34,426 | 33,034 |
| 2020's | 10,585 | 26,184 | 14,901 | 14,447 |
| - = No Data Reported; -- = Not Applicable; NA = Not Available; W = Withheld to avoid disclosure of individual company data. |
| Release Date: 6/28/2024 |
| Next Release Date: 8/30/2024 |