|
Download Data (XLS File) |
|
||||||||
|
||||||||
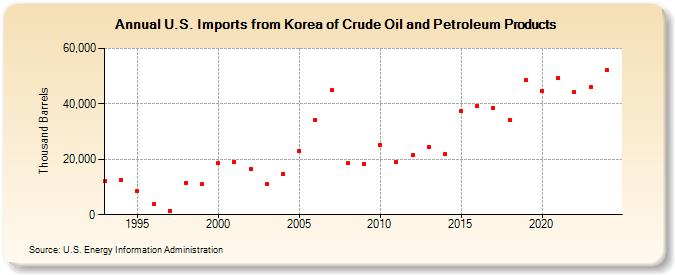
| U.S. Imports from Korea of Crude Oil and Petroleum Products (Thousand Barrels) | ||||||||
| Decade | Year-0 | Year-1 | Year-2 | Year-3 | Year-4 | Year-5 | Year-6 | Year-7 | Year-8 | Year-9 |
|---|---|---|---|---|---|---|---|---|---|---|
| 1990's | 12,000 | 12,475 | 8,398 | 3,708 | 1,499 | 11,474 | 10,903 | |||
| 2000's | 18,500 | 19,036 | 16,525 | 11,226 | 14,794 | 23,001 | 34,330 | 44,889 | 18,553 | 18,173 |
| 2010's | 25,026 | 19,185 | 21,479 | 24,504 | 21,845 | 37,258 | 39,306 | 38,468 | 34,264 | 48,663 |
| 2020's | 44,572 | 49,362 | 44,151 | 45,752 |
| - = No Data Reported; -- = Not Applicable; NA = Not Available; W = Withheld to avoid disclosure of individual company data. |
| Release Date: 3/29/2024 |
| Next Release Date: 8/30/2024 |