|
Download Data (XLS File) |
|
||||||||
|
||||||||
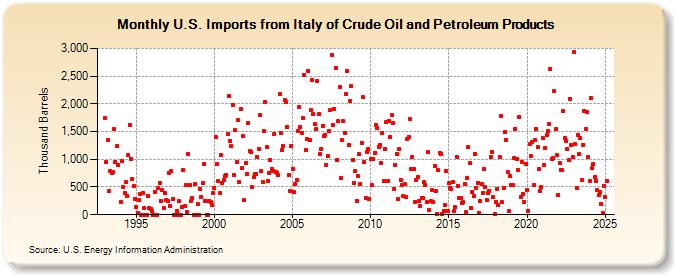
| U.S. Imports from Italy of Crude Oil and Petroleum Products (Thousand Barrels) | ||||||||
| Year | Jan | Feb | Mar | Apr | May | Jun | Jul | Aug | Sep | Oct | Nov | Dec |
|---|---|---|---|---|---|---|---|---|---|---|---|---|
| 1993 | 1,744 | 955 | 1,346 | 422 | 795 | 749 | 779 | 1,542 | 954 | 1,241 | 902 | |
| 1994 | 237 | 968 | 495 | 400 | 592 | 345 | 1,081 | 1,620 | 1,011 | 649 | 520 | 276 |
| 1995 | 134 | 23 | 257 | 379 | 0 | 386 | 118 | 0 | 0 | 334 | 128 | 105 |
| 1996 | 60 | 0 | 404 | 2 | 0 | 476 | 578 | 246 | 440 | 120 | 394 | 257 |
| 1997 | 254 | 759 | 154 | 787 | 281 | 0 | 0 | 75 | 0 | 241 | 0 | 144 |
| 1998 | 809 | 156 | 542 | 51 | 1,099 | 537 | 245 | 304 | 0 | 545 | 0 | 185 |
| 1999 | 0 | 468 | 324 | 568 | 920 | 253 | 0 | 0 | 252 | 232 | 168 | 395 |
| 2000 | 490 | 1,406 | 911 | 602 | 392 | 1,071 | 566 | 621 | 707 | 724 | 1,457 | 2,136 |
| 2001 | 1,331 | 1,235 | 1,985 | 717 | 1,521 | 957 | 1,710 | 585 | 1,901 | 837 | 1,423 | 260 |
| 2002 | 934 | 740 | 1,660 | 1,144 | 1,129 | 492 | 680 | 742 | 731 | 1,043 | 1,193 | 1,799 |
| 2003 | 780 | 587 | 1,508 | 2,028 | 1,224 | 607 | 755 | 990 | 831 | 782 | 1,461 | 771 |
| 2004 | 748 | 710 | 2,185 | 1,467 | 1,171 | 1,233 | 2,062 | 2,040 | 1,575 | 712 | 430 | 1,246 |
| 2005 | 828 | 404 | 550 | 618 | 1,518 | 1,950 | 1,580 | 1,468 | 1,741 | 2,517 | 1,167 | 1,361 |
| 2006 | 2,593 | 1,349 | 1,886 | 2,426 | 1,815 | 1,637 | 1,549 | 2,419 | 1,809 | 1,089 | 1,181 | 1,597 |
| 2007 | 1,424 | 1,445 | 899 | 1,052 | 1,509 | 1,885 | 2,888 | 1,621 | 1,913 | 2,655 | 992 | 1,685 |
| 2008 | 2,312 | 665 | 1,351 | 1,684 | 1,482 | 2,175 | 2,593 | 1,258 | 2,047 | 2,320 | 990 | 570 |
| 2009 | 793 | 254 | 691 | 1,090 | 558 | 1,300 | 2,121 | 951 | 309 | 1,138 | 1,183 | 291 |
| 2010 | 1,002 | 529 | 1,004 | 1,119 | 1,614 | 1,566 | 1,228 | 1,264 | 936 | 1,477 | 609 | 1,182 |
| 2011 | 1,673 | 605 | 1,693 | 1,408 | 1,790 | 1,650 | 455 | 893 | 1,104 | 289 | 1,189 | 630 |
| 2012 | 541 | 341 | 547 | 319 | 1,359 | 1,400 | 1,735 | 824 | 1,049 | 826 | 232 | 623 |
| 2013 | 682 | 246 | 150 | 305 | 299 | 582 | 543 | 232 | 1,132 | 77 | 239 | 437 |
| 2014 | 221 | 872 | 424 | 9 | 806 | 1,121 | 1,100 | 5 | 70 | 169 | 794 | 74 |
| 2015 | 567 | 481 | 470 | 584 | 69 | 138 | 1,050 | 523 | 305 | 296 | 219 | 223 |
| 2016 | 557 | 42 | 670 | 1,230 | 926 | 129 | 418 | 338 | 1,103 | 488 | 580 | 28 |
| 2017 | 239 | 558 | 396 | 824 | 503 | 261 | 391 | 431 | 1,039 | 1,138 | 311 | 19 |
| 2018 | 234 | 470 | 168 | 1,035 | 1,782 | 221 | 484 | 1,487 | 1,354 | 773 | 61 | 693 |
| 2019 | 541 | 528 | 1,023 | 1,552 | 1,011 | 815 | 1,766 | 312 | 958 | 379 | 225 | 920 |
| 2020 | 447 | 71 | 1,270 | 1,053 | 1,319 | 535 | 1,339 | 1,546 | 1,216 | 827 | 421 | 505 |
| 2021 | 1,379 | 901 | 1,203 | 1,444 | 1,511 | 1,632 | 2,631 | 1,013 | 1,014 | 2,223 | 1,540 | 1,077 |
| 2022 | 356 | 930 | 811 | 809 | 1,863 | 1,380 | 1,321 | 1,185 | 982 | 2,094 | 1,261 | 1,033 |
| 2023 | 2,941 | 1,269 | 483 | 1,440 | 1,088 | 1,378 | 619 | 1,266 | 1,874 | 1,553 | 1,855 | 1,050 |
| 2024 | 610 | |||||||||||
| - = No Data Reported; -- = Not Applicable; NA = Not Available; W = Withheld to avoid disclosure of individual company data. |
| Release Date: 3/29/2024 |
| Next Release Date: 4/30/2024 |