|
Download Data (XLS File) |
|
||||||||
|
||||||||
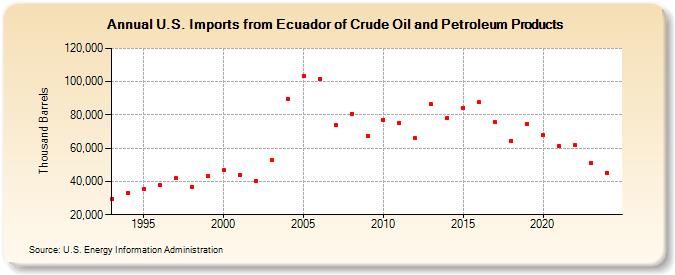
| U.S. Imports from Ecuador of Crude Oil and Petroleum Products (Thousand Barrels) | ||||||||
| Decade | Year-0 | Year-1 | Year-2 | Year-3 | Year-4 | Year-5 | Year-6 | Year-7 | Year-8 | Year-9 |
|---|---|---|---|---|---|---|---|---|---|---|
| 1990's | 29,534 | 33,333 | 35,471 | 37,960 | 41,879 | 36,882 | 43,019 | |||
| 2000's | 46,821 | 43,676 | 40,262 | 52,752 | 89,640 | 103,153 | 101,457 | 74,179 | 80,714 | 67,471 |
| 2010's | 77,224 | 75,072 | 65,913 | 86,278 | 78,413 | 84,176 | 87,565 | 75,627 | 64,597 | 74,612 |
| 2020's | 67,899 | 61,303 | 61,617 | 51,138 |
| - = No Data Reported; -- = Not Applicable; NA = Not Available; W = Withheld to avoid disclosure of individual company data. |
| Release Date: 3/29/2024 |
| Next Release Date: 8/30/2024 |