|
Download Data (XLS File) |
|
||||||||
|
||||||||
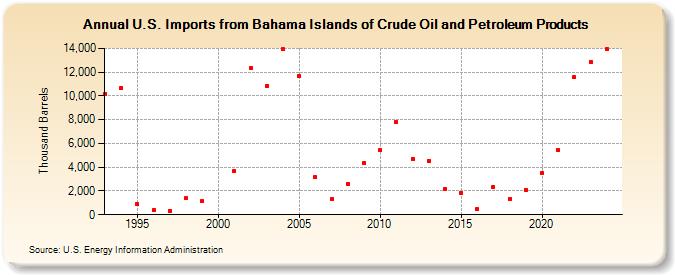
| U.S. Imports from Bahama Islands of Crude Oil and Petroleum Products (Thousand Barrels) | ||||||||
| Decade | Year-0 | Year-1 | Year-2 | Year-3 | Year-4 | Year-5 | Year-6 | Year-7 | Year-8 | Year-9 |
|---|---|---|---|---|---|---|---|---|---|---|
| 1990's | 10,164 | 10,684 | 877 | 408 | 350 | 1,384 | 1,157 | |||
| 2000's | 3,696 | 12,339 | 10,831 | 13,916 | 11,693 | 3,143 | 1,325 | 2,610 | 4,393 | |
| 2010's | 5,467 | 7,826 | 4,720 | 4,556 | 2,157 | 1,852 | 445 | 2,326 | 1,356 | 2,106 |
| 2020's | 3,547 | 5,449 | 11,564 | 12,873 |
| - = No Data Reported; -- = Not Applicable; NA = Not Available; W = Withheld to avoid disclosure of individual company data. |
| Release Date: 8/30/2024 |
| Next Release Date: 8/29/2025 |