|
Download Data (XLS File) |
|
||||||||
|
||||||||
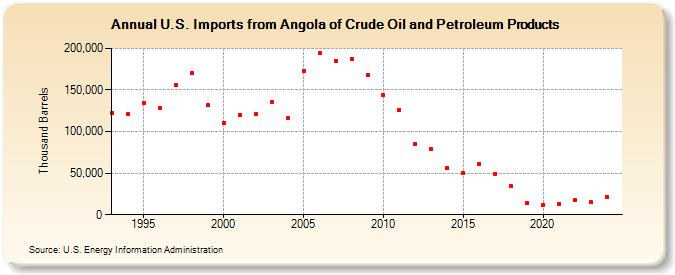
| U.S. Imports from Angola of Crude Oil and Petroleum Products (Thousand Barrels) | ||||||||
| Decade | Year-0 | Year-1 | Year-2 | Year-3 | Year-4 | Year-5 | Year-6 | Year-7 | Year-8 | Year-9 |
|---|---|---|---|---|---|---|---|---|---|---|
| 1990's | 122,741 | 120,926 | 133,996 | 128,629 | 156,023 | 170,911 | 131,585 | |||
| 2000's | 110,321 | 119,710 | 121,185 | 135,559 | 115,708 | 172,609 | 195,048 | 185,352 | 187,790 | 167,877 |
| 2010's | 143,512 | 126,259 | 85,335 | 78,672 | 56,343 | 49,767 | 61,492 | 49,108 | 34,330 | 14,021 |
| 2020's | 11,329 | 13,088 | 17,201 | 14,697 |
| - = No Data Reported; -- = Not Applicable; NA = Not Available; W = Withheld to avoid disclosure of individual company data. |
| Release Date: 4/30/2024 |
| Next Release Date: 8/30/2024 |