|
Download Data (XLS File) |
|
||||||||
|
||||||||
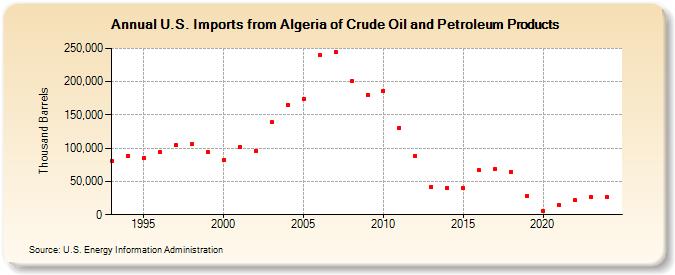
| U.S. Imports from Algeria of Crude Oil and Petroleum Products (Thousand Barrels) | ||||||||
| Decade | Year-0 | Year-1 | Year-2 | Year-3 | Year-4 | Year-5 | Year-6 | Year-7 | Year-8 | Year-9 |
|---|---|---|---|---|---|---|---|---|---|---|
| 1990's | 80,118 | 88,744 | 85,475 | 93,762 | 104,088 | 105,729 | 94,373 | |||
| 2000's | 82,345 | 101,440 | 96,230 | 139,333 | 165,346 | 174,652 | 239,959 | 244,605 | 200,652 | 180,018 |
| 2010's | 186,019 | 130,723 | 88,487 | 42,014 | 40,193 | 39,478 | 66,544 | 68,867 | 64,422 | 28,500 |
| 2020's | 5,507 | 14,425 | 21,538 | 26,130 |
| - = No Data Reported; -- = Not Applicable; NA = Not Available; W = Withheld to avoid disclosure of individual company data. |
| Release Date: 3/29/2024 |
| Next Release Date: 8/30/2024 |