|
Download Data (XLS File) |
|
||||||||
|
||||||||
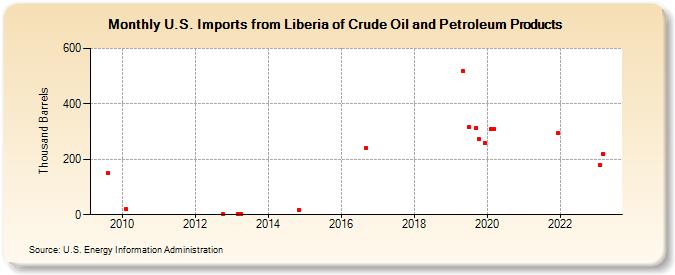
| U.S. Imports from Liberia of Crude Oil and Petroleum Products (Thousand Barrels) | ||||||||
| Year | Jan | Feb | Mar | Apr | May | Jun | Jul | Aug | Sep | Oct | Nov | Dec |
|---|---|---|---|---|---|---|---|---|---|---|---|---|
| 2009 | 150 | |||||||||||
| 2010 | 20 | |||||||||||
| 2012 | 1 | |||||||||||
| 2013 | 1 | 1 | ||||||||||
| 2014 | 18 | |||||||||||
| 2016 | 241 | |||||||||||
| 2017 | 75 | |||||||||||
| 2019 | 517 | 315 | 313 | 274 | 258 | |||||||
| 2020 | 308 | 311 | ||||||||||
| 2021 | 294 | |||||||||||
| 2023 | 180 | 220 | ||||||||||
| - = No Data Reported; -- = Not Applicable; NA = Not Available; W = Withheld to avoid disclosure of individual company data. |
| Release Date: 4/30/2024 |
| Next Release Date: 5/31/2024 |