|
Download Data (XLS File) |
|
||||||||
|
||||||||
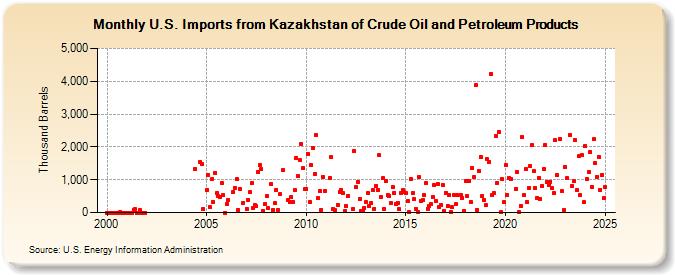
| U.S. Imports from Kazakhstan of Crude Oil and Petroleum Products (Thousand Barrels) | ||||||||
| Year | Jan | Feb | Mar | Apr | May | Jun | Jul | Aug | Sep | Oct | Nov | Dec |
|---|---|---|---|---|---|---|---|---|---|---|---|---|
| 2000 | 0 | 0 | 0 | 0 | 0 | 0 | 0 | 0 | 29 | 0 | 0 | 0 |
| 2001 | 0 | 0 | 0 | 0 | 79 | 97 | 0 | 0 | 75 | 0 | 0 | 0 |
| 2004 | 1,340 | 1,552 | 1,492 | 108 | ||||||||
| 2005 | 697 | 1,143 | 181 | 1,023 | 310 | 1,218 | 592 | 517 | 468 | 906 | 527 | 1 |
| 2006 | 247 | 383 | 630 | 751 | 1,015 | 92 | 723 | 300 | ||||
| 2007 | 121 | 394 | 625 | 887 | 142 | 237 | 192 | 1,223 | 1,434 | 1,322 | 54 | 250 |
| 2008 | 495 | 129 | 860 | 73 | 289 | 697 | 85 | 557 | 1,281 | |||
| 2009 | 390 | 319 | 481 | 318 | 686 | 1,670 | 1,116 | 1,589 | 2,080 | 1,344 | 703 | |
| 2010 | 723 | 1,777 | 323 | 1,436 | 1,969 | 1,188 | 2,348 | 443 | 654 | 75 | 1,097 | 665 |
| 2011 | 1,052 | 1,677 | 109 | 79 | 232 | 623 | 693 | 583 | 40 | |||
| 2012 | 200 | 518 | 104 | 1,872 | 776 | 943 | 420 | 45 | 45 | 149 | ||
| 2013 | 314 | 587 | 205 | 284 | 687 | 119 | 812 | 700 | 1,745 | 484 | 1,044 | 111 |
| 2014 | 954 | 522 | 517 | 289 | 777 | 610 | 263 | 300 | 96 | 609 | 676 | 621 |
| 2015 | 585 | 338 | 3 | 1,027 | 598 | 407 | 102 | 6 | 1,081 | 367 | 376 | 526 |
| 2016 | 890 | 119 | 189 | 259 | 473 | 842 | 355 | 863 | 159 | 225 | 846 | 58 |
| 2017 | 608 | 200 | 537 | 5 | 159 | 532 | 256 | 523 | 535 | 446 | 52 | |
| 2018 | 966 | 490 | 952 | 319 | 1,356 | 1,082 | 3,877 | 92 | 1,257 | 1,694 | 493 | 383 |
| 2019 | 219 | 1,622 | 1,555 | 4,214 | 523 | 596 | 2,323 | 904 | 2,465 | 3 | 1,022 | 316 |
| 2020 | 1,447 | 536 | 1,056 | 1,023 | 731 | 1,235 | 28 | 207 | 2,304 | 528 | ||
| 2021 | 1,333 | 317 | 752 | 1,416 | 2,045 | 1,252 | 750 | 449 | 1,067 | 422 | 821 | 1,313 |
| 2022 | 2,060 | 945 | 841 | 945 | 744 | 603 | 2,197 | 1,140 | 2,236 | 644 | 70 | |
| 2023 | 1,395 | 1,043 | 2,367 | 821 | 952 | 2,195 | 686 | 1,709 | 533 | 1,747 | 309 | |
| 2024 | 2,022 | |||||||||||
| - = No Data Reported; -- = Not Applicable; NA = Not Available; W = Withheld to avoid disclosure of individual company data. |
| Release Date: 3/29/2024 |
| Next Release Date: 4/30/2024 |