|
Download Data (XLS File) |
|
||||||||
|
||||||||
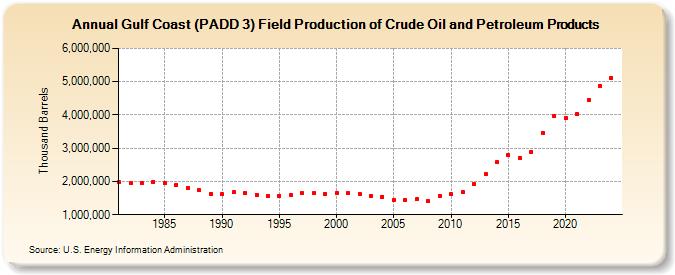
| Gulf Coast (PADD 3) Field Production of Crude Oil and Petroleum Products (Thousand Barrels) | ||||||||
| Decade | Year-0 | Year-1 | Year-2 | Year-3 | Year-4 | Year-5 | Year-6 | Year-7 | Year-8 | Year-9 |
|---|---|---|---|---|---|---|---|---|---|---|
| 1980's | 1,969,563 | 1,943,171 | 1,940,836 | 1,996,804 | 1,958,766 | 1,903,116 | 1,808,786 | 1,739,065 | 1,637,433 | |
| 1990's | 1,619,764 | 1,667,915 | 1,655,767 | 1,602,519 | 1,567,755 | 1,572,501 | 1,607,583 | 1,650,098 | 1,647,064 | 1,633,469 |
| 2000's | 1,661,116 | 1,648,164 | 1,629,408 | 1,565,646 | 1,545,604 | 1,437,197 | 1,447,964 | 1,459,244 | 1,409,873 | 1,566,485 |
| 2010's | 1,620,877 | 1,671,300 | 1,926,373 | 2,209,372 | 2,574,743 | 2,781,154 | 2,703,238 | 2,894,586 | 3,455,391 | 3,970,590 |
| 2020's | 3,917,934 | 4,018,071 | 4,428,407 | 4,856,750 |
| - = No Data Reported; -- = Not Applicable; NA = Not Available; W = Withheld to avoid disclosure of individual company data. |
| Release Date: 3/29/2024 |
| Next Release Date: 8/30/2024 |