|
Download Data (XLS File) |
|
||||||||
|
||||||||
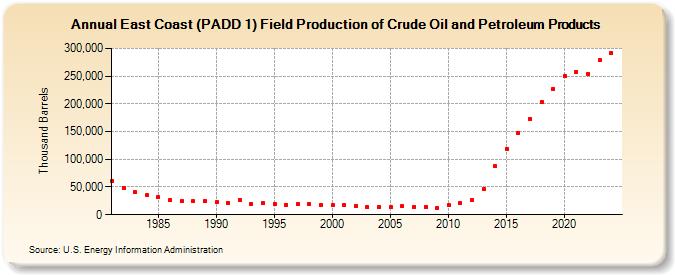
| East Coast (PADD 1) Field Production of Crude Oil and Petroleum Products (Thousand Barrels) | ||||||||
| Decade | Year-0 | Year-1 | Year-2 | Year-3 | Year-4 | Year-5 | Year-6 | Year-7 | Year-8 | Year-9 |
|---|---|---|---|---|---|---|---|---|---|---|
| 1980's | 60,161 | 48,205 | 40,416 | 34,679 | 31,771 | 26,815 | 24,590 | 24,151 | 24,515 | |
| 1990's | 22,140 | 21,682 | 27,125 | 20,103 | 20,358 | 19,383 | 17,662 | 18,940 | 19,206 | 17,443 |
| 2000's | 17,191 | 16,870 | 15,890 | 13,771 | 13,735 | 13,243 | 15,023 | 14,568 | 14,232 | 12,874 |
| 2010's | 16,943 | 20,977 | 25,946 | 46,723 | 90,583 | 122,568 | 148,025 | 173,621 | 202,711 | 227,265 |
| 2020's | 251,251 | 257,807 | 252,311 | 279,188 |
| - = No Data Reported; -- = Not Applicable; NA = Not Available; W = Withheld to avoid disclosure of individual company data. |
| Release Date: 3/29/2024 |
| Next Release Date: 8/30/2024 |