|
Download Data (XLS File) |
|
||||||||
|
||||||||
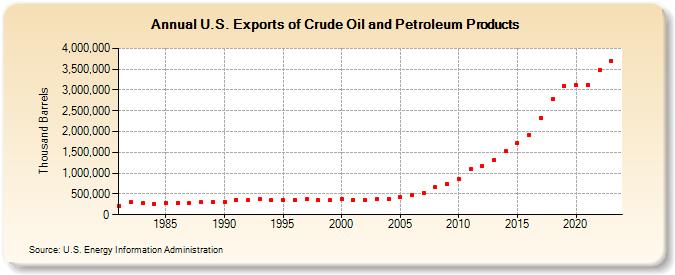
| U.S. Exports of Crude Oil and Petroleum Products (Thousand Barrels) | ||||||||
| Decade | Year-0 | Year-1 | Year-2 | Year-3 | Year-4 | Year-5 | Year-6 | Year-7 | Year-8 | Year-9 |
|---|---|---|---|---|---|---|---|---|---|---|
| 1980's | 217,024 | 297,513 | 269,854 | 264,077 | 285,069 | 286,373 | 278,731 | 298,466 | 313,460 | |
| 1990's | 312,671 | 365,341 | 347,584 | 365,974 | 343,896 | 346,477 | 358,897 | 366,258 | 344,757 | 343,017 |
| 2000's | 380,710 | 354,421 | 359,077 | 374,710 | 383,636 | 425,190 | 480,561 | 522,879 | 659,392 | 738,803 |
| 2010's | 858,685 | 1,089,848 | 1,172,965 | 1,321,787 | 1,524,170 | 1,729,378 | 1,925,369 | 2,327,156 | 2,774,451 | 3,092,070 |
| 2020's | 3,110,251 | 3,115,563 | 3,474,738 | 3,704,655 |
| - = No Data Reported; -- = Not Applicable; NA = Not Available; W = Withheld to avoid disclosure of individual company data. |
| Release Date: 6/28/2024 |
| Next Release Date: 8/30/2024 |