|
Download Data (XLS File) |
|
||||||||
|
||||||||
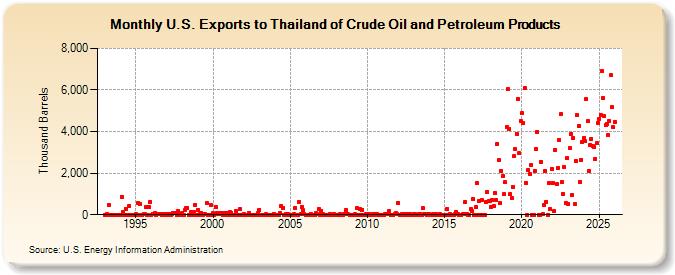
| U.S. Exports to Thailand of Crude Oil and Petroleum Products (Thousand Barrels) | ||||||||
| Year | Jan | Feb | Mar | Apr | May | Jun | Jul | Aug | Sep | Oct | Nov | Dec |
|---|---|---|---|---|---|---|---|---|---|---|---|---|
| 1993 | 2 | 4 | 17 | 484 | 4 | 2 | 6 | 9 | 3 | 10 | 7 | 8 |
| 1994 | 2 | 872 | 147 | 6 | 297 | 3 | 5 | 421 | 9 | 4 | 2 | 10 |
| 1995 | 32 | 3 | 555 | 497 | 3 | 7 | 21 | 21 | 388 | 5 | 386 | 624 |
| 1996 | 5 | 49 | 17 | 80 | 8 | 22 | 33 | 12 | 9 | 11 | 4 | 15 |
| 1997 | 3 | 12 | 13 | 7 | 19 | 100 | 97 | 100 | 8 | 174 | 8 | 10 |
| 1998 | 70 | 9 | 214 | 304 | 315 | 9 | 5 | 109 | 2 | 111 | 484 | 5 |
| 1999 | 233 | 3 | 42 | 104 | 4 | 41 | 45 | 550 | 6 | 4 | 480 | 2 |
| 2000 | 62 | 2 | 366 | 64 | 57 | 61 | 58 | 66 | 3 | 76 | 5 | 64 |
| 2001 | 4 | 122 | 93 | 7 | 6 | 4 | 156 | 6 | 4 | 284 | 4 | 4 |
| 2002 | 32 | 3 | 10 | 5 | 106 | 6 | 7 | 7 | 2 | 4 | 9 | 78 |
| 2003 | 246 | 6 | 5 | 3 | 3 | 11 | 4 | 3 | 9 | 5 | 4 | 40 |
| 2004 | 2 | 3 | 3 | 3 | 68 | 411 | 324 | 4 | 5 | 31 | 13 | 6 |
| 2005 | 3 | 4 | 5 | 17 | 326 | 5 | 3 | 628 | 22 | 384 | 214 | 12 |
| 2006 | 3 | 4 | 7 | 7 | 23 | 9 | 3 | 2 | 66 | 13 | 271 | 6 |
| 2007 | 180 | 15 | 5 | 6 | 6 | 5 | 4 | 12 | 7 | 8 | 16 | 4 |
| 2008 | 7 | 7 | 10 | 12 | 8 | 7 | 20 | 213 | 13 | 16 | 8 | 3 |
| 2009 | 5 | 3 | 11 | 5 | 306 | 6 | 277 | 6 | 241 | 6 | 5 | 14 |
| 2010 | 5 | 17 | 8 | 7 | 14 | 9 | 11 | 11 | 7 | 9 | 9 | 6 |
| 2011 | 9 | 7 | 15 | 23 | 17 | 169 | 9 | 7 | 5 | 16 | 60 | 16 |
| 2012 | 575 | 8 | 9 | 11 | 10 | 14 | 10 | 11 | 9 | 13 | 5 | 9 |
| 2013 | 29 | 24 | 7 | 9 | 18 | 21 | 6 | 306 | 18 | 12 | 9 | 16 |
| 2014 | 13 | 5 | 9 | 19 | 6 | 13 | 10 | 7 | 12 | 6 | 4 | 4 |
| 2015 | 5 | 4 | 287 | 7 | 11 | 5 | 6 | 6 | 13 | 121 | 12 | 4 |
| 2016 | 6 | 5 | 11 | 11 | 608 | 13 | 6 | 6 | 257 | 161 | 774 | 9 |
| 2017 | 374 | 1,508 | 7 | 673 | 7 | 713 | 7 | 9 | 603 | 1,109 | 657 | 679 |
| 2018 | 389 | 689 | 405 | 1,053 | 708 | 3,416 | 2,617 | 557 | 2,093 | 1,854 | 981 | 1,552 |
| 2019 | 4,205 | 6,034 | 4,142 | 982 | 812 | 1,336 | 2,812 | 3,148 | 3,892 | 5,570 | 2,951 | 4,515 |
| 2020 | 4,878 | 4,409 | 6,117 | 1,538 | 4 | 2,156 | 1,968 | 2,401 | 4 | 3 | 2,105 | 3,148 |
| 2021 | 3,982 | 7 | 7 | 2,557 | 13 | 489 | 2,095 | 622 | 2 | 1,534 | 265 | 2,217 |
| 2022 | 1,541 | 165 | 3,103 | 1,455 | 2,235 | 3,593 | 4,831 | 1,567 | 997 | 2,303 | 580 | 2,721 |
| 2023 | 255 | 3,216 | 3,343 | 1,152 | 3,686 | 511 | 2,574 | 4,786 | 4,489 | 858 | 2,644 | 3,527 |
| 2024 | 3,069 | |||||||||||
| - = No Data Reported; -- = Not Applicable; NA = Not Available; W = Withheld to avoid disclosure of individual company data. |
| Release Date: 3/29/2024 |
| Next Release Date: 4/30/2024 |