|
Download Data (XLS File) |
|
||||||||
|
||||||||
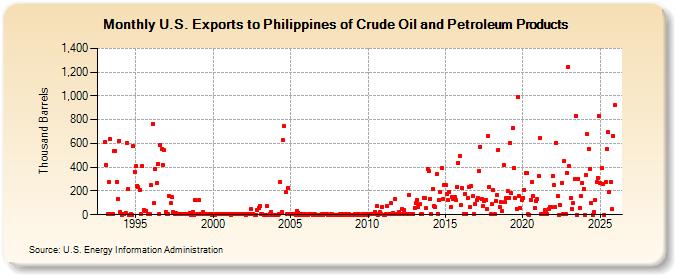
| U.S. Exports to Philippines of Crude Oil and Petroleum Products (Thousand Barrels) | ||||||||
| Year | Jan | Feb | Mar | Apr | May | Jun | Jul | Aug | Sep | Oct | Nov | Dec |
|---|---|---|---|---|---|---|---|---|---|---|---|---|
| 1993 | 611 | 422 | 2 | 273 | 637 | 3 | 8 | 538 | 539 | 279 | 133 | 623 |
| 1994 | 27 | 1 | 6 | 2 | 13 | 606 | 218 | 1 | 3 | 1 | 578 | 361 |
| 1995 | 407 | 242 | 230 | 205 | 3 | 408 | 40 | 32 | 34 | 3 | 3 | 3 |
| 1996 | 250 | 767 | 97 | 383 | 265 | 427 | 4 | 591 | 554 | 415 | 542 | 26 |
| 1997 | 2 | 7 | 155 | 96 | 145 | 21 | 6 | 12 | 7 | 2 | 7 | 7 |
| 1998 | 5 | 3 | 5 | 2 | 2 | 8 | 14 | 1 | 25 | 1 | 123 | 2 |
| 1999 | 4 | 123 | 3 | 3 | 25 | 3 | 2 | 3 | 2 | 6 | 6 | 1 |
| 2000 | 2 | 1 | 2 | 3 | 5 | 2 | 2 | 8 | 2 | 3 | 3 | 2 |
| 2001 | 2 | 2 | 1 | 4 | 4 | 3 | 4 | 4 | 7 | 4 | 4 | 4 |
| 2002 | 2 | 1 | 3 | 2 | 4 | 44 | 2 | 2 | 1 | 1 | 38 | 60 |
| 2003 | 73 | 2 | 2 | 1 | 1 | 1 | 70 | 1 | 2 | 25 | 1 | 1 |
| 2004 | 1 | 1 | 1 | 3 | 273 | 23 | 626 | 744 | 189 | 3 | 225 | 2 |
| 2005 | 2 | 5 | 3 | 2 | 1 | 35 | 17 | 1 | 2 | 2 | 1 | 2 |
| 2006 | 1 | 1 | 2 | 2 | 2 | 0 | 3 | 2 | 1 | 1 | 1 | 1 |
| 2007 | 2 | 1 | 2 | 3 | 2 | 0 | 1 | 2 | 2 | 1 | 1 | 1 |
| 2008 | 1 | 1 | 2 | 1 | 4 | 1 | 2 | 2 | 1 | 2 | 1 | 1 |
| 2009 | 0 | 1 | 2 | 10 | 1 | 2 | 1 | 1 | 2 | 1 | 2 | 2 |
| 2010 | 1 | 3 | 2 | 2 | 2 | 23 | 2 | 70 | 1 | 24 | 4 | 66 |
| 2011 | 1 | 1 | 3 | 75 | 2 | 4 | 95 | 13 | 3 | 129 | 4 | 2 |
| 2012 | 23 | 8 | 46 | 4 | 41 | 2 | 8 | 10 | 166 | 3 | 3 | 3 |
| 2013 | 58 | 96 | 127 | 65 | 88 | 2 | 2 | 143 | 144 | 55 | 385 | 364 |
| 2014 | 132 | 3 | 216 | 74 | 67 | 340 | 8 | 128 | 190 | 395 | 133 | 253 |
| 2015 | 251 | 175 | 123 | 194 | 65 | 148 | 131 | 151 | 124 | 237 | 436 | 494 |
| 2016 | 79 | 223 | 4 | 177 | 3 | 141 | 232 | 63 | 241 | 154 | 4 | 91 |
| 2017 | 121 | 142 | 366 | 574 | 135 | 72 | 115 | 126 | 52 | 664 | 237 | 2 |
| 2018 | 86 | 207 | 3 | 117 | 167 | 548 | 68 | 106 | 29 | 417 | 104 | 141 |
| 2019 | 197 | 143 | 605 | 183 | 730 | 395 | 138 | 52 | 995 | 154 | 54 | 124 |
| 2020 | 144 | 209 | 353 | 352 | 2 | 1 | 124 | 275 | 158 | 58 | 114 | 133 |
| 2021 | 322 | 642 | 3 | 3 | 3 | 40 | 15 | 2 | 46 | 65 | 64 | 327 |
| 2022 | 250 | 61 | 607 | 156 | 1 | 83 | 270 | 5 | 450 | 3 | 355 | 1,244 |
| 2023 | 270 | 139 | 53 | 96 | 299 | 833 | 1 | 302 | 57 | 157 | 269 | 219 |
| 2024 | 1 | |||||||||||
| - = No Data Reported; -- = Not Applicable; NA = Not Available; W = Withheld to avoid disclosure of individual company data. |
| Release Date: 3/29/2024 |
| Next Release Date: 4/30/2024 |