|
Download Data (XLS File) |
|
||||||||
|
||||||||
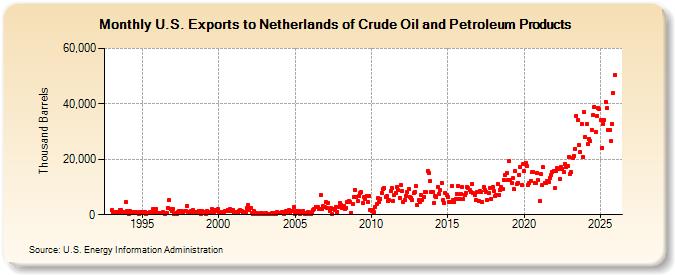
| U.S. Exports to Netherlands of Crude Oil and Petroleum Products (Thousand Barrels) | ||||||||
| Year | Jan | Feb | Mar | Apr | May | Jun | Jul | Aug | Sep | Oct | Nov | Dec |
|---|---|---|---|---|---|---|---|---|---|---|---|---|
| 1993 | 1,572 | 1,104 | 441 | 798 | 1,106 | 911 | 1,779 | 1,581 | 761 | 983 | 722 | 4,674 |
| 1994 | 1,408 | 425 | 1,452 | 976 | 1,062 | 599 | 1,083 | 1,059 | 717 | 375 | 1,129 | 767 |
| 1995 | 919 | 789 | 1,091 | 151 | 687 | 700 | 1,123 | 468 | 2,054 | 1,066 | 948 | 2,062 |
| 1996 | 489 | 529 | 491 | 667 | 873 | 682 | 294 | 765 | 2,573 | 5,263 | 2,013 | 1,209 |
| 1997 | 2,021 | 256 | 464 | 374 | 1,067 | 1,248 | 1,466 | 1,158 | 1,146 | 1,177 | 1,429 | 3,253 |
| 1998 | 801 | 797 | 1,176 | 673 | 1,637 | 1,011 | 1,012 | 904 | 1,396 | 1,258 | 88 | 1,295 |
| 1999 | 1,094 | 581 | 367 | 1,367 | 975 | 606 | 995 | 2,005 | 828 | 1,683 | 1,363 | 1,970 |
| 2000 | 1,145 | 590 | 616 | 1,070 | 944 | 1,372 | 1,315 | 1,841 | 1,377 | 1,910 | 1,460 | 1,606 |
| 2001 | 648 | 791 | 1,111 | 678 | 1,445 | 1,593 | 1,190 | 841 | 1,102 | 1,143 | 2,470 | 3,482 |
| 2002 | 1,856 | 2,250 | 769 | 104 | 1,166 | 421 | 508 | 103 | 102 | 504 | 454 | 230 |
| 2003 | 339 | 737 | 84 | 419 | 178 | 104 | 691 | 151 | 720 | 180 | 1,122 | 749 |
| 2004 | 499 | 541 | 924 | 181 | 988 | 1,437 | 943 | 1,611 | 814 | 1,198 | 1,303 | 2,868 |
| 2005 | 421 | 1,346 | 869 | 1,265 | 313 | 779 | 1,293 | 780 | 405 | 298 | 880 | 489 |
| 2006 | 398 | 924 | 1,599 | 2,029 | 2,935 | 2,817 | 2,657 | 1,933 | 7,048 | 2,182 | 2,989 | 2,859 |
| 2007 | 4,408 | 2,559 | 4,157 | 1,243 | 2,344 | 174 | 2,222 | 1,621 | 2,707 | 979 | 2,717 | 4,364 |
| 2008 | 3,429 | 2,436 | 3,300 | 2,166 | 2,530 | 4,422 | 4,897 | 4,604 | 768 | 3,840 | 6,405 | 9,039 |
| 2009 | 6,287 | 4,824 | 6,742 | 7,840 | 8,060 | 4,341 | 6,417 | 5,811 | 6,724 | 4,726 | 6,777 | 1,708 |
| 2010 | 1,215 | 1,696 | 889 | 2,910 | 3,944 | 5,854 | 4,759 | 5,743 | 7,948 | 9,148 | 9,556 | 6,469 |
| 2011 | 6,581 | 5,045 | 5,192 | 8,599 | 9,682 | 4,888 | 7,048 | 7,948 | 9,943 | 8,863 | 6,127 | 10,779 |
| 2012 | 8,449 | 4,665 | 5,437 | 6,821 | 8,183 | 9,244 | 6,500 | 6,119 | 5,378 | 7,866 | 8,325 | 10,352 |
| 2013 | 3,655 | 5,177 | 4,432 | 7,117 | 5,336 | 6,543 | 8,331 | 8,093 | 15,815 | 15,127 | 12,058 | 8,329 |
| 2014 | 8,208 | 4,372 | 6,924 | 6,337 | 10,063 | 7,504 | 8,880 | 11,454 | 5,150 | 4,298 | 7,958 | 6,968 |
| 2015 | 6,436 | 4,662 | 4,485 | 10,282 | 5,388 | 4,524 | 5,716 | 7,407 | 10,468 | 5,810 | 7,634 | 9,839 |
| 2016 | 5,659 | 7,219 | 7,839 | 9,932 | 9,691 | 9,036 | 8,117 | 11,164 | 7,732 | 6,987 | 5,307 | 8,151 |
| 2017 | 4,820 | 8,575 | 8,308 | 4,559 | 9,908 | 8,768 | 8,354 | 5,165 | 7,822 | 9,673 | 5,816 | 9,992 |
| 2018 | 8,529 | 6,677 | 7,139 | 11,063 | 7,103 | 8,842 | 9,994 | 9,338 | 12,549 | 14,335 | 15,105 | 12,367 |
| 2019 | 19,226 | 12,370 | 11,534 | 13,198 | 9,121 | 15,744 | 10,994 | 11,557 | 14,345 | 17,142 | 10,791 | 18,460 |
| 2020 | 15,647 | 18,559 | 17,507 | 10,724 | 11,554 | 12,331 | 15,299 | 15,267 | 11,407 | 11,264 | 14,876 | 12,364 |
| 2021 | 4,925 | 14,623 | 10,562 | 17,048 | 11,593 | 11,343 | 12,244 | 11,834 | 13,261 | 14,192 | 15,436 | 15,840 |
| 2022 | 9,530 | 15,856 | 16,712 | 16,430 | 12,828 | 17,215 | 16,582 | 15,237 | 18,245 | 17,332 | 17,743 | 20,884 |
| 2023 | 18,661 | 14,449 | 28,667 | 23,008 | 23,177 | 35,227 | 35,552 | 22,147 | 23,429 | 32,940 | 22,823 | 35,157 |
| 2024 | 35,016 | |||||||||||
| - = No Data Reported; -- = Not Applicable; NA = Not Available; W = Withheld to avoid disclosure of individual company data. |
| Release Date: 3/29/2024 |
| Next Release Date: 4/30/2024 |