|
Download Data (XLS File) |
|
||||||||
|
||||||||
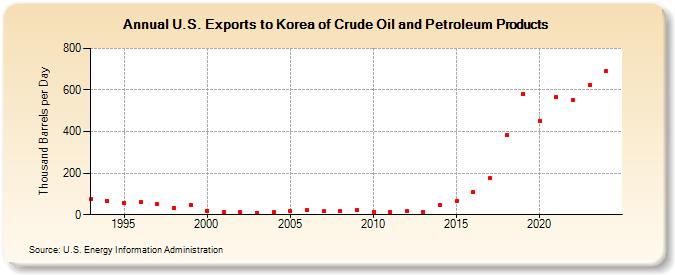
| U.S. Exports to Korea of Crude Oil and Petroleum Products (Thousand Barrels per Day) | ||||||||
| Decade | Year-0 | Year-1 | Year-2 | Year-3 | Year-4 | Year-5 | Year-6 | Year-7 | Year-8 | Year-9 |
|---|---|---|---|---|---|---|---|---|---|---|
| 1990's | 74 | 66 | 57 | 60 | 50 | 33 | 49 | |||
| 2000's | 20 | 14 | 11 | 10 | 12 | 16 | 21 | 16 | 18 | 23 |
| 2010's | 13 | 15 | 16 | 13 | 46 | 65 | 108 | 176 | 382 | 580 |
| 2020's | 451 | 565 | 550 | 602 |
| - = No Data Reported; -- = Not Applicable; NA = Not Available; W = Withheld to avoid disclosure of individual company data. |
| Release Date: 3/29/2024 |
| Next Release Date: 8/30/2024 |