|
Download Data (XLS File) |
|
||||||||
|
||||||||
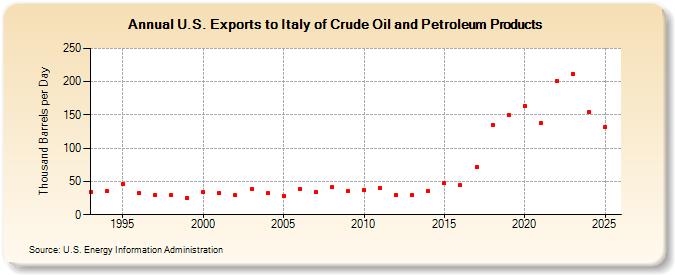
| U.S. Exports to Italy of Crude Oil and Petroleum Products (Thousand Barrels per Day) | ||||||||
| Decade | Year-0 | Year-1 | Year-2 | Year-3 | Year-4 | Year-5 | Year-6 | Year-7 | Year-8 | Year-9 |
|---|---|---|---|---|---|---|---|---|---|---|
| 1990's | 34 | 35 | 46 | 32 | 30 | 30 | 25 | |||
| 2000's | 34 | 33 | 29 | 39 | 32 | 28 | 39 | 34 | 41 | 35 |
| 2010's | 37 | 40 | 30 | 30 | 36 | 47 | 44 | 72 | 135 | 150 |
| 2020's | 164 | 138 | 201 | 204 |
| - = No Data Reported; -- = Not Applicable; NA = Not Available; W = Withheld to avoid disclosure of individual company data. |
| Release Date: 4/30/2024 |
| Next Release Date: 8/30/2024 |