|
Download Data (XLS File) |
|
||||||||
|
||||||||
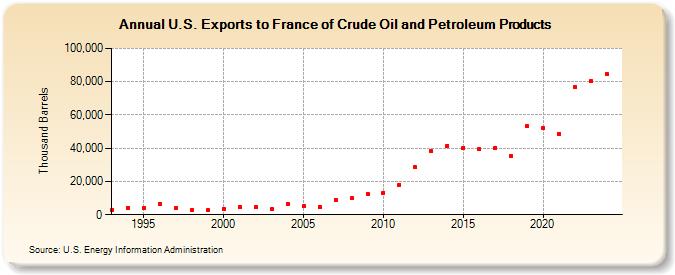
| U.S. Exports to France of Crude Oil and Petroleum Products (Thousand Barrels) | ||||||||
| Decade | Year-0 | Year-1 | Year-2 | Year-3 | Year-4 | Year-5 | Year-6 | Year-7 | Year-8 | Year-9 |
|---|---|---|---|---|---|---|---|---|---|---|
| 1990's | 3,079 | 4,190 | 4,007 | 6,498 | 3,931 | 3,036 | 2,667 | |||
| 2000's | 3,686 | 4,691 | 4,412 | 3,264 | 6,524 | 4,989 | 4,778 | 8,929 | 9,831 | 12,528 |
| 2010's | 13,317 | 18,139 | 28,444 | 38,222 | 41,590 | 40,322 | 39,566 | 40,147 | 35,162 | 53,267 |
| 2020's | 52,427 | 48,744 | 76,896 | 80,421 |
| - = No Data Reported; -- = Not Applicable; NA = Not Available; W = Withheld to avoid disclosure of individual company data. |
| Release Date: 8/30/2024 |
| Next Release Date: 8/29/2025 |