|
Download Data (XLS File) |
|
||||||||
|
||||||||
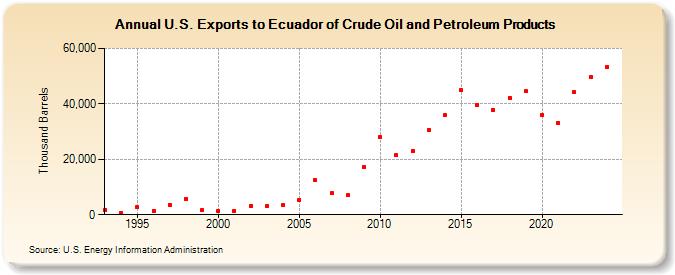
| U.S. Exports to Ecuador of Crude Oil and Petroleum Products (Thousand Barrels) | ||||||||
| Decade | Year-0 | Year-1 | Year-2 | Year-3 | Year-4 | Year-5 | Year-6 | Year-7 | Year-8 | Year-9 |
|---|---|---|---|---|---|---|---|---|---|---|
| 1990's | 1,749 | 657 | 2,641 | 1,437 | 3,575 | 5,848 | 1,546 | |||
| 2000's | 1,327 | 1,437 | 3,090 | 2,988 | 3,437 | 5,442 | 12,348 | 7,733 | 6,964 | 17,168 |
| 2010's | 27,990 | 21,424 | 23,058 | 30,576 | 35,918 | 44,898 | 39,512 | 37,685 | 42,201 | 44,527 |
| 2020's | 36,130 | 33,211 | 44,162 | 49,516 |
| - = No Data Reported; -- = Not Applicable; NA = Not Available; W = Withheld to avoid disclosure of individual company data. |
| Release Date: 8/30/2024 |
| Next Release Date: 8/29/2025 |