|
Download Data (XLS File) |
|
||||||||
|
||||||||
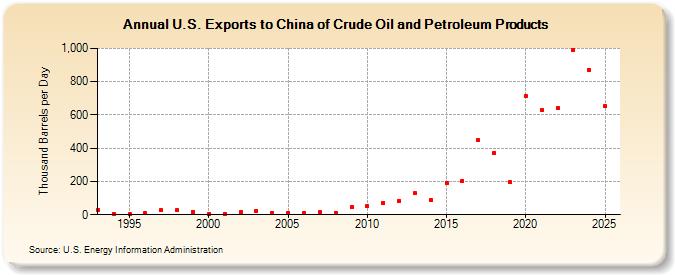
| U.S. Exports to China of Crude Oil and Petroleum Products (Thousand Barrels per Day) | ||||||||
| Decade | Year-0 | Year-1 | Year-2 | Year-3 | Year-4 | Year-5 | Year-6 | Year-7 | Year-8 | Year-9 |
|---|---|---|---|---|---|---|---|---|---|---|
| 1990's | 29 | 7 | 2 | 8 | 26 | 26 | 19 | |||
| 2000's | 3 | 6 | 14 | 24 | 13 | 12 | 11 | 14 | 13 | 44 |
| 2010's | 52 | 73 | 85 | 129 | 89 | 191 | 203 | 447 | 374 | 196 |
| 2020's | 715 | 632 | 641 | 977 |
| - = No Data Reported; -- = Not Applicable; NA = Not Available; W = Withheld to avoid disclosure of individual company data. |
| Release Date: 6/28/2024 |
| Next Release Date: 8/30/2024 |