|
Download Data (XLS File) |
|
||||||||
|
||||||||
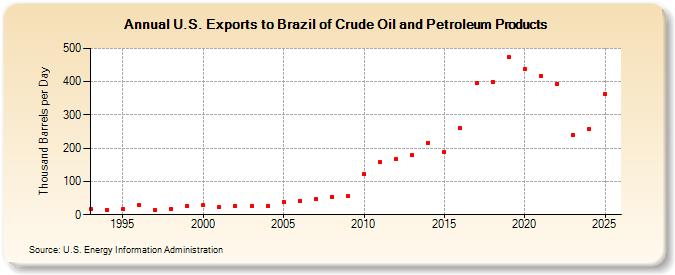
| U.S. Exports to Brazil of Crude Oil and Petroleum Products (Thousand Barrels per Day) | ||||||||
| Decade | Year-0 | Year-1 | Year-2 | Year-3 | Year-4 | Year-5 | Year-6 | Year-7 | Year-8 | Year-9 |
|---|---|---|---|---|---|---|---|---|---|---|
| 1990's | 16 | 15 | 16 | 29 | 15 | 18 | 27 | |||
| 2000's | 28 | 23 | 26 | 27 | 27 | 39 | 42 | 46 | 54 | 55 |
| 2010's | 123 | 157 | 166 | 179 | 217 | 188 | 260 | 395 | 400 | 474 |
| 2020's | 438 | 418 | 394 | 240 |
| - = No Data Reported; -- = Not Applicable; NA = Not Available; W = Withheld to avoid disclosure of individual company data. |
| Release Date: 3/29/2024 |
| Next Release Date: 8/30/2024 |