|
Download Data (XLS File) |
|
||||||||
|
||||||||
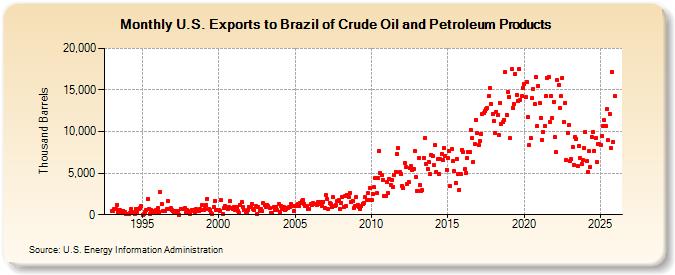
| U.S. Exports to Brazil of Crude Oil and Petroleum Products (Thousand Barrels) | ||||||||
| Year | Jan | Feb | Mar | Apr | May | Jun | Jul | Aug | Sep | Oct | Nov | Dec |
|---|---|---|---|---|---|---|---|---|---|---|---|---|
| 1993 | 388 | 454 | 659 | 682 | 1,191 | 359 | 615 | 354 | 265 | 499 | 282 | 74 |
| 1994 | 68 | 100 | 266 | 739 | 335 | 148 | 88 | 734 | 352 | 692 | 824 | 1,028 |
| 1995 | 5 | 94 | 345 | 579 | 1,881 | 727 | 112 | 595 | 451 | 173 | 169 | 613 |
| 1996 | 816 | 334 | 2,700 | 1,307 | 396 | 439 | 487 | 656 | 1,629 | 636 | 788 | 528 |
| 1997 | 457 | 350 | 493 | 167 | 463 | 23 | 722 | 706 | 708 | 761 | 253 | 519 |
| 1998 | 312 | 95 | 485 | 606 | 610 | 295 | 651 | 544 | 405 | 660 | 604 | 1,141 |
| 1999 | 545 | 720 | 1,204 | 1,931 | 701 | 536 | 173 | 113 | 900 | 1,707 | 601 | 588 |
| 2000 | 527 | 494 | 1,728 | 137 | 764 | 1,009 | 855 | 649 | 944 | 1,597 | 751 | 741 |
| 2001 | 969 | 623 | 893 | 502 | 190 | 1,143 | 1,520 | 901 | 523 | 235 | 379 | 584 |
| 2002 | 963 | 875 | 1,299 | 672 | 548 | 1,026 | 143 | 912 | 497 | 733 | 428 | 1,404 |
| 2003 | 1,110 | 946 | 1,183 | 1,016 | 811 | 244 | 253 | 912 | 609 | 980 | 523 | 1,316 |
| 2004 | 342 | 1,096 | 740 | 948 | 619 | 741 | 847 | 922 | 918 | 1,279 | 1,029 | 459 |
| 2005 | 1,009 | 1,134 | 1,282 | 1,031 | 1,442 | 1,657 | 1,810 | 1,340 | 1,082 | 1,082 | 682 | 730 |
| 2006 | 1,282 | 1,111 | 1,351 | 1,240 | 1,248 | 1,220 | 1,478 | 1,265 | 1,573 | 1,100 | 1,588 | 808 |
| 2007 | 2,399 | 1,864 | 650 | 1,383 | 1,260 | 923 | 2,128 | 1,106 | 1,144 | 1,620 | 1,785 | 676 |
| 2008 | 1,465 | 2,134 | 921 | 2,209 | 1,001 | 2,340 | 2,077 | 2,644 | 1,549 | 1,664 | 861 | 1,061 |
| 2009 | 2,104 | 1,168 | 942 | 629 | 1,073 | 1,320 | 1,413 | 2,098 | 1,773 | 2,580 | 1,726 | 3,162 |
| 2010 | 1,728 | 2,467 | 3,280 | 4,372 | 2,566 | 4,468 | 7,658 | 5,005 | 4,780 | 4,218 | 2,254 | 2,261 |
| 2011 | 3,882 | 2,595 | 4,278 | 3,609 | 4,190 | 3,378 | 4,830 | 5,122 | 7,317 | 7,977 | 5,100 | 4,953 |
| 2012 | 3,468 | 3,196 | 6,223 | 5,680 | 3,685 | 3,936 | 5,599 | 5,859 | 5,373 | 5,511 | 7,664 | 4,487 |
| 2013 | 2,890 | 6,862 | 3,575 | 2,887 | 2,927 | 6,829 | 9,229 | 6,073 | 5,537 | 6,342 | 4,853 | 7,182 |
| 2014 | 7,029 | 5,939 | 8,364 | 5,169 | 6,659 | 4,923 | 6,692 | 7,342 | 6,557 | 8,025 | 7,119 | 5,420 |
| 2015 | 6,773 | 7,666 | 3,411 | 7,859 | 6,405 | 5,239 | 3,819 | 6,689 | 4,913 | 3,017 | 4,886 | 7,827 |
| 2016 | 7,540 | 5,494 | 5,016 | 6,828 | 7,483 | 7,524 | 10,191 | 9,243 | 6,333 | 8,467 | 11,422 | 9,779 |
| 2017 | 8,367 | 8,887 | 9,676 | 12,160 | 12,189 | 12,432 | 12,701 | 12,858 | 14,287 | 15,253 | 13,324 | 12,111 |
| 2018 | 11,252 | 9,786 | 12,375 | 11,993 | 9,543 | 13,486 | 10,959 | 11,099 | 11,401 | 17,179 | 12,039 | 14,744 |
| 2019 | 14,182 | 9,189 | 17,471 | 12,854 | 13,259 | 16,958 | 14,436 | 13,730 | 17,540 | 13,815 | 14,266 | 15,276 |
| 2020 | 15,699 | 14,121 | 16,003 | 11,729 | 8,326 | 9,211 | 14,008 | 15,060 | 13,297 | 16,511 | 10,653 | 15,510 |
| 2021 | 13,445 | 11,676 | 9,038 | 9,942 | 10,701 | 14,249 | 16,461 | 16,551 | 11,161 | 14,265 | 11,586 | 13,588 |
| 2022 | 9,334 | 7,490 | 16,195 | 15,541 | 12,787 | 14,243 | 16,474 | 11,196 | 13,484 | 6,599 | 9,827 | 10,757 |
| 2023 | 6,478 | 6,110 | 8,748 | 5,939 | 9,349 | 9,155 | 6,459 | 8,765 | 6,774 | 6,269 | 6,253 | 7,242 |
| 2024 | 10,300 | |||||||||||
| - = No Data Reported; -- = Not Applicable; NA = Not Available; W = Withheld to avoid disclosure of individual company data. |
| Release Date: 3/29/2024 |
| Next Release Date: 4/30/2024 |