|
Download Data (XLS File) |
|
||||||||
|
||||||||
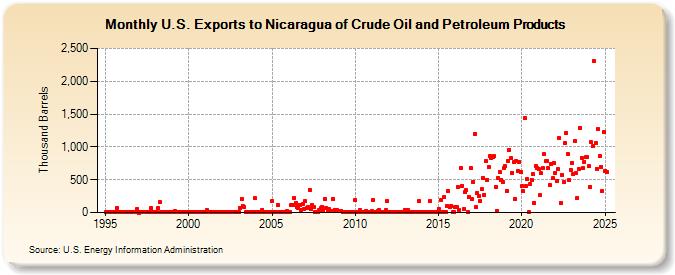
| U.S. Exports to Nicaragua of Crude Oil and Petroleum Products (Thousand Barrels) | ||||||||
| Year | Jan | Feb | Mar | Apr | May | Jun | Jul | Aug | Sep | Oct | Nov | Dec |
|---|---|---|---|---|---|---|---|---|---|---|---|---|
| 1995 | 1 | 1 | 1 | 1 | 1 | 1 | 1 | 1 | 73 | 2 | 1 | 1 |
| 1996 | 1 | 2 | 2 | 2 | 2 | 1 | 1 | 1 | 1 | 1 | 1 | 61 |
| 1997 | 0 | 1 | 1 | 7 | 1 | 2 | 2 | 1 | 1 | 63 | 1 | 1 |
| 1998 | 3 | 2 | 63 | 160 | 1 | 2 | 2 | 1 | 1 | 2 | 1 | 1 |
| 1999 | 2 | 2 | 27 | 3 | 1 | 1 | 2 | 2 | 5 | 1 | 1 | 1 |
| 2000 | 1 | 1 | 1 | 1 | 3 | 1 | 1 | 2 | 1 | 2 | 2 | 2 |
| 2001 | 3 | 32 | 4 | 3 | 3 | 8 | 4 | 4 | 2 | 2 | 3 | 5 |
| 2002 | 2 | 5 | 3 | 5 | 1 | 3 | 3 | 2 | 3 | 2 | 4 | 4 |
| 2003 | 2 | 71 | 212 | 102 | 83 | 2 | 3 | 2 | 3 | 6 | 4 | 2 |
| 2004 | 216 | 3 | 4 | 8 | 5 | 44 | 7 | 6 | 2 | 6 | 8 | 3 |
| 2005 | 169 | 1 | 5 | 4 | 116 | 3 | 2 | 4 | 5 | 8 | 7 | 25 |
| 2006 | 1 | 3 | 108 | 113 | 222 | 143 | 89 | 67 | 116 | 46 | 127 | 53 |
| 2007 | 169 | 68 | 81 | 350 | 58 | 112 | 80 | 5 | 3 | 5 | 33 | 65 |
| 2008 | 85 | 23 | 203 | 69 | 22 | 47 | 25 | 24 | 210 | 41 | 31 | 32 |
| 2009 | 17 | 30 | 25 | 3 | 4 | 5 | 4 | 4 | 1 | 4 | 5 | 4 |
| 2010 | 184 | 3 | 8 | 40 | 6 | 5 | 3 | 4 | 29 | 5 | 4 | 7 |
| 2011 | 18 | 188 | 7 | 8 | 23 | 36 | 4 | 7 | 5 | 3 | 37 | 174 |
| 2012 | 4 | 5 | 8 | 7 | 10 | 7 | 6 | 5 | 8 | 9 | 10 | 7 |
| 2013 | 35 | 5 | 37 | 6 | 14 | 6 | 7 | 7 | 8 | 9 | 172 | 7 |
| 2014 | 7 | 7 | 4 | 5 | 7 | 8 | 175 | 5 | 5 | 6 | 5 | 5 |
| 2015 | 55 | 4 | 195 | 6 | 243 | 9 | 107 | 326 | 86 | 106 | 7 | 5 |
| 2016 | 85 | 89 | 386 | 37 | 678 | 406 | 53 | 307 | 337 | 4 | 232 | 675 |
| 2017 | 200 | 472 | 1,201 | 79 | 300 | 248 | 174 | 353 | 523 | 275 | 784 | 500 |
| 2018 | 693 | 864 | 830 | 847 | 859 | 390 | 31 | 530 | 611 | 503 | 469 | 671 |
| 2019 | 704 | 326 | 792 | 957 | 824 | 610 | 769 | 203 | 785 | 634 | 773 | 614 |
| 2020 | 403 | 323 | 1,439 | 404 | 508 | 2 | 433 | 498 | 588 | 146 | 704 | 680 |
| 2021 | 659 | 261 | 595 | 673 | 894 | 786 | 788 | 673 | 417 | 747 | 521 | 759 |
| 2022 | 606 | 484 | 658 | 1,134 | 148 | 576 | 462 | 1,057 | 1,210 | 895 | 499 | 652 |
| 2023 | 765 | 592 | 1,139 | 606 | 223 | 723 | 1,231 | 835 | 628 | 833 | 841 | 841 |
| 2024 | 703 | |||||||||||
| - = No Data Reported; -- = Not Applicable; NA = Not Available; W = Withheld to avoid disclosure of individual company data. |
| Release Date: 3/29/2024 |
| Next Release Date: 4/30/2024 |