|
Download Data (XLS File) |
|
||||||||
|
||||||||
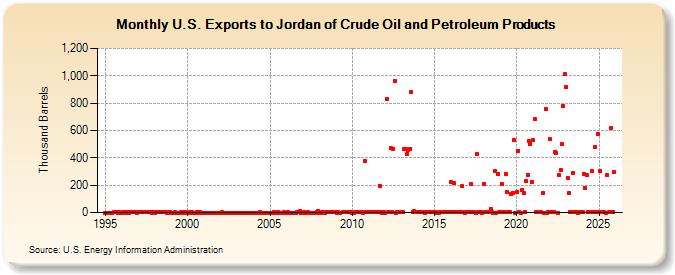
| U.S. Exports to Jordan of Crude Oil and Petroleum Products (Thousand Barrels) | ||||||||
| Year | Jan | Feb | Mar | Apr | May | Jun | Jul | Aug | Sep | Oct | Nov | Dec |
|---|---|---|---|---|---|---|---|---|---|---|---|---|
| 1995 | 0 | 0 | 0 | 0 | 0 | 0 | 1 | 1 | 1 | 0 | 1 | 0 |
| 1996 | 0 | 1 | 1 | 0 | 1 | 0 | 1 | 1 | 1 | 1 | 1 | 0 |
| 1997 | 1 | 1 | 1 | 1 | 1 | 1 | 1 | 1 | 1 | 1 | 0 | 1 |
| 1998 | 0 | 1 | 1 | 1 | 1 | 1 | 1 | 1 | 1 | 0 | 1 | 1 |
| 1999 | 0 | 0 | 0 | 1 | 0 | 0 | 0 | 1 | 0 | 1 | 1 | 0 |
| 2000 | 0 | 1 | 0 | 2 | 0 | 0 | 0 | 1 | 0 | 1 | 0 | 0 |
| 2001 | 0 | 0 | 0 | 0 | 0 | 0 | 0 | 0 | 0 | 0 | 0 | 0 |
| 2002 | 0 | 1 | 0 | 0 | 0 | 0 | 0 | 0 | 0 | 0 | 0 | 0 |
| 2003 | 0 | 0 | 0 | 0 | 0 | 0 | 0 | 0 | 0 | 0 | 0 | 0 |
| 2004 | 0 | 0 | 0 | 0 | 0 | 1 | 0 | 0 | 0 | 0 | 0 | 0 |
| 2005 | 0 | 0 | 0 | 2 | 0 | 0 | 1 | 0 | 0 | 0 | 2 | 0 |
| 2006 | 0 | 1 | 0 | 0 | 0 | 0 | 0 | 0 | 1 | 1 | 9 | 0 |
| 2007 | 0 | 1 | 0 | 0 | 1 | 0 | 0 | 0 | 0 | 0 | 1 | 12 |
| 2008 | 0 | 0 | 1 | 1 | 0 | 1 | 1 | 1 | 1 | 1 | 1 | 1 |
| 2009 | 1 | 0 | 1 | 0 | 1 | 2 | 2 | 1 | 1 | 1 | 1 | |
| 2010 | 0 | 0 | 1 | 1 | 2 | 1 | 1 | 2 | 0 | 378 | 1 | 1 |
| 2011 | 2 | 1 | 1 | 1 | 1 | 1 | 1 | 1 | 195 | 1 | 0 | 1 |
| 2012 | 0 | 830 | 2 | 1 | 472 | 1 | 465 | 965 | 0 | 2 | 1 | 3 |
| 2013 | 1 | 1 | 467 | 468 | 426 | 457 | 467 | 882 | 1 | 11 | 7 | 5 |
| 2014 | 5 | 2 | 1 | 1 | 1 | 0 | 1 | 1 | 1 | 1 | 1 | 2 |
| 2015 | 1 | 1 | 0 | 0 | 3 | 2 | 2 | 1 | 1 | 3 | 2 | 1 |
| 2016 | 222 | 2 | 215 | 5 | 1 | 2 | 1 | 4 | 191 | 1 | 0 | 1 |
| 2017 | 2 | 2 | 1 | 209 | 4 | 1 | 0 | 428 | 1 | 1 | 1 | 0 |
| 2018 | 211 | 1 | 2 | 1 | 1 | 29 | 3 | 0 | 301 | 0 | 281 | 2 |
| 2019 | 1 | 212 | 1 | 2 | 284 | 150 | 1 | 1 | 137 | 143 | 534 | 0 |
| 2020 | 150 | 451 | 1 | 0 | 168 | 141 | 2 | 228 | 276 | 520 | 504 | 227 |
| 2021 | 528 | 682 | 1 | 1 | 2 | 1 | 1 | 142 | 0 | 756 | 0 | 2 |
| 2022 | 536 | 1 | 2 | 1 | 446 | 438 | 0 | 272 | 312 | 500 | 778 | 1,010 |
| 2023 | 602 | 314 | 102 | 3 | 1 | 292 | 2 | 2 | 1 | 0 | 1 | 2 |
| 2024 | 2 | |||||||||||
| - = No Data Reported; -- = Not Applicable; NA = Not Available; W = Withheld to avoid disclosure of individual company data. |
| Release Date: 3/29/2024 |
| Next Release Date: 4/30/2024 |